Assignment 2
Due October 12 at 11:59pm
Overview
This assignment is designed to support
your in-class understanding of how data analytics stacks work
and the factors influencing their performance. You will
deploy SPARK, an in-memory big data analytics framework and
one of the most popular open source projects nowadays. Similar
to assignment 1, you will run a set of SQL queries (or "jobs")
atop SPARK SQL using SPARK standalone as an execution
framework and HDFS as the distributed filesystem. You
will learn how to use various SPARK contexts and how to write
your own driver program and queries using SPARK
API. Finally, you will produce a short report detailing
your observations, scripts and takeaways.
Learning Outcomes
After completing this assignment, you should:
- Have gotten a hands-on experience in deploying a SPARK-style data analytics stack.
- Be able to reason about SPARK's performance under specific operating parameters.
- Have gotten experience in using SPARK SQL and SPARK contexts.
- Be able to reason about performance of recurring jobs when various RDDs are cached.
- Be able to write simple queries using SPARK APIs.
Setup
VM configuration
For this assignment you will use the same set of 4 VMs we provided for assignment-1. In addition to the steps mentioned in assignment-1, you need to perform the following:
- Create a hierarchy of directories required during the software deployment. This hierarchy should exist on all the VMs and it is required by various frameworks specific configurations.
- /home/ubuntu/storage/data/spark/rdds_shuffle. // directory to store shuffle data and RDDs that get spilled to disk
- /home/ubuntu/logs/spark. // directory to store spark related logs
- /home/ubuntu/storage/data/spark/worker. // directory to run apps in, which will include both logs and scratch space
Software deployment
The following will help you deploy all the software needed, and set the proper configurations required for this assignment. You need to replace your run.sh script from assignment-1 with an updated version of run.sh. The script should be updated on every machine and incorporates additional information required to run the SPARK stack. It defines new environment variables and new commands to start and stop your SPARK cluster.
- SPARK_HOME=/home/ubuntu/software/spark-1.5.0-bin-hadoop2.6. // specify the home directory for your SPARK installation
- SPARK_CONF_DIR=/home/ubuntu/conf. // specify the location of the configuration files required by SPARK
- SPARK_MASTER_IP=ip_master (e.g. 10.0.1.13). // specify the IP of the Master
- SPARK_LOCAL_DIRS=/home/ubuntu/storage/data/spark/rdds_shuffle. // specify the directory to store RDDs and shuffle input
- SPARK_LOG_DIR=/home/ubuntu/logs/spark. // specify the directory to store spark process logs
- SPARK_WORKER_DIR=/home/ubuntu/logs/apps_spark. // application logs directory
To run in cluster mode, you need to create a slaves file in your $SPARK_CONF_DIR directory. The file should contains the IP address of every VM which will run a Worker daemon, one per line.
Next, we will go through deploying the SPARK stack. The following figure describes the software stack you will deploy:
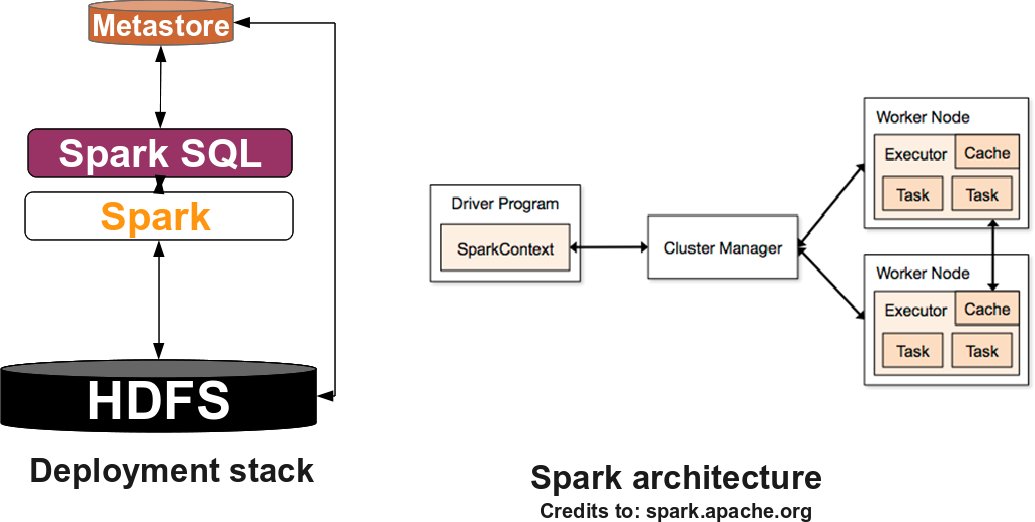
SPARK
You will use HDFS as the underlying
filesystem. You already deployed HDFS for assignment-1. If our
HDFS daemons are down, you can start them
using start_hdfs command
available through run.sh
from your master VM.
To become familiar with the terminology, SPARK standalone consists of a set of daemons: a Master daemon, which is the equivalent of the ResourceManager in YARN terminology, and a set of Worker daemons, equivalent to the NodeManager processes. SPARK applications are coordinated by a SparkContext object which will connect to the Master, responsible for allocating resources across applications. Once connected, SPARK acquires Executors on every Worker node in the cluster, which are processes that run computations and store data for your applications. Finally, the application's tasks are handled to Executors for execution. You can read further about the SPARK architecture here.
Now that you are familiar with the SPARK terminology, download spark-1.5.0-bin-hadoop2.6.tgz . Deploy the archive in the /home/ubuntu/software directory on every VM and untar it (tar -xzvf spark-1.5.0-bin-hadoop2.6.tgz).
You should modify hive-site.xml and set the hive.metastore.uris property to thrift://ip_master:9083. Before launching the SPARK daemons, you should set the proper environment variables from the script run.sh.
Finally, you can instantiate the SPARK daemons by running start_spark on your Master VM. To check that the cluster is up and running you can check that a Master process is running on your master VM, and a Worker is running on each of your slave VMs. In addition you can check the status of your SPARK cluster, at the following URLs:
- http://public_ip_master:50070 for HDFS.
- http://public_ip_master:8080 for SPARK.
- http://public_ip_master:4040 for your application context. Note that this will be available only when a SparkContext is running.
SPARK SQL
Unlike Hive, which requires proper deployment, SPARK SQL is tightly integrated in the SPARK stack. No further action is required in order to enable SPARK SQL.
Workload
For the purpose of this assignment, you will benchmark the same set of SQL queries you used in assignment-1: queries 12, 21, 50, 85 from the TPC-DS benchmark.
You should use the same workload generator as before. To run SPARK SQL queries for question1 you need the following information:
- You need to run hive metastore in the background on your master VM using the command:
hive --service metastore &. This will give you access to the databases you created for assignment-1 and persisted in Hive metastore.
You should start the Thrift JDBC server, which allows you to connect to the databases in your Hive metastore:
start-thriftserver.sh --master spark://master_IP:7077 --driver-memory 1g --conf spark.eventLog.enabled=true --conf spark.eventLog.dir=/home/ubuntu/storage/logs --conf spark.executor.memory=21000m --conf spark.executor.cores=4 --conf spark.task.cpus=1 &.
Once started, you see an application running in your web UI interface on port 8080. Thrift server allows you to overwrite various SPARK default properties. Our configuration specifies that every executor JVM can allocate 21 GB of memory and 4 cores, with 1 core allocated for each task. These specific values are chosen in order to provide a similar cluster capacity as in assignment-1 and a fair comparison of the results.
Finally, run_query_spark.sql is a simple script which allows you to submit a TPC-DS query to SPARK SQL using beeline tool. You should place it in /home/ubuntu/workload. More precisely, it runs the command:
(beeline -u jdbc:hive2://master_IP:10000/tpcds_text_db_1_50 -n `whoami` -p ignored -f sample-queries-tpcds/query12.sql) 2> output/query12_spark_sql.out
where query12.sql represents the query script you want to run and tpcds_text_db_1_50 is the corresponding database holding the data and generated using generate_data.sh script as described in assignment-1.
Note: for questions 1 and 2 you will need to use the same 50 GB TPC-DS database you used for the assignment 1. Otherwise, you should regenerate a new one with the same characteristics.
Questions
Once you have the SPARK software stack running, you should answer each of the questions listed below. Question1 will let you evaluate query performance and will provide hands-on experience in handling the framework. Question2 allows you to evaluate performance when data is cached in-between consecutive runs of the same query. Question3 will give you a basic understanding on how to write simple queries using SPARK APIs.
Question1
Part A
In this experiment, you will run each of the
queries mentioned above which are located
in /home/ubuntu/workload/sample-queries-tpcds. You
will run a query at a time using SPARK SQL. As a general note,
please clear the memory cache (sudo sh -c "sync;
echo 3 > /proc/sys/vm/drop_caches") and remove any content from
your $SPARK_LOCAL_DIRS on every VM before any
query run, in order to avoid any potential caching in memory or
disk from previous runs. It is also recommended to restart the Thrift
server every time you do an experiment.
You should start the Thrift server with the following configuration parameters:
start-thriftserver.sh --master spark://master_IP:7077 --driver-memory 1g --conf spark.eventLog.enabled=true --conf spark.eventLog.dir=/home/ubuntu/storage/logs --conf spark.executor.memory=21000m --conf spark.executor.cores=4 --conf spark.task.cpus=1 &.
For every query, you should compute the following:
- Plot the query completion time. Your plot should have four queries on the X-axis, and three columns for each query: one describing the job completion time with SPARK SQL, one with Hive/MR and one with Hive/Tez. For Hive you should plot the results from assignment-1.
What do you observe? Is SPARK SQL always better than Hive/MR and Hive/TEZ? By how much? Is the difference always constant? If not, why?
- Compute the amount of network/storage read/write bandwidth used during the query lifetime. Your plot(s) should clearly describe the amount of data read/written from network/disk for every query. You should compare your results with the ones you collected for Hive/MR and Hive/Tez. What do you observe? Is there a trend? What are the possible explanations for your results/anomalies?
- Compute various statistics exploring the log history files. More precisely, for every query, you should compute the following: total number of tasks; ratio of tasks which aggregates data versus the number of tasks which read data from HDFS; tasks distribution over query lifetime. Is there any correlation between these metrics and performance? Also, how do these numbers compare with the same results for Hive/Tez and Hive/MR that you computed in assignment-1?.
The log history files should be located in the location specified by spark.eventLog.dir. Alternatively, this information is also visually available at http://public_ip_master:4040.
- Visually plot the DAGs generated by SPARK SQL. http://public_ip_master:4040 gives you a very nice and detailed representation of the DAGs. How different are these DAGs across the queries? What do you observe? Do you think their structure can impact performance? If yes/no, why? What observations can you draw in comparison with the DAGs generated by Hive/MR and Hive/Tez for the same queries?
Part B
Pick query21. In what follows, you will try different values for a specific parameter and see whether performance improves or not. Pick and fix the best value for that parameter and move to the next.
More specifically, you have to tune the following parameters:
- Vary the number of partitions to use when shuffling data for joins or aggregations to 5, 50, 100, 200. You should do that by specifying --conf spark.sql.shuffle.partitions=X when starting the Thrift server. Is the performance impacted by different values for this parameter?
- Vary the amount of RAM you can use for caching your imtermediate data on the cluster. In SPARK the amount of RAM to cache your data is computed by the following equation:
spark.storage.safetyFraction * spark.storage.memoryFraction * #WorkerMachines * #ExecutorsPerMachine * MemoryPerExecutor
where spark.storage.safetyFraction=0.9 and spark.storage.memoryFraction=0.6.
In our setup, if we have 4 Worker machines, the available memory to cache the data is equal with: 0.9 * 0.6 * 4 * 1 * 21 = 45.35 GB.
You should run query21 configuring spark.storage.memoryFraction property with the following values: 0.02, 0.05, 0.1, 0.2, 0.4, 0.9. Does the performance change for different values of this parameter? Explain. Do you see any RDDs spilled to disk? You can check this at http://public_ip_master:4040 in the storage tab for any of these values?
Part C
In this experiment you will analyze performance in the presence of failures. For query 21, you should trigger two types of failures on a desired Worker VM when the job reaches 25% and 75% of its lifetime.
The two failure scenarios you should evaluate are the following:
- Clear the memory cache using sudo sh -c "sync; echo 3 > /proc/sys/vm/drop_caches".
- Kill the Worker process.
You should analyze the variations in query job completion time. What type of failures impact performance more? Explain your observations.
Question2
As default, neither SPARK nor SPARK SQL is automatically persisting the RDDs in memory across jobs. Your task is to evaluate performance when various RDDs are persisted across consecutive runs of the same job. Unfortunately beeline tool used in Question1 does not allow you to persist RDDs. You need to encapsulate your SQL query in a Scala or Python script where you have fine grain control over different RDDs required for the query.
More precisely you should do the following:
- Pick TPC-DS query 12.
- Write a Scala or Python script to execute the query using spark-submit.
- When you write your script, please ensure that your SparkContext object is overwriting the following properties:
- set application name to CS-838-Assignment2-Question2 .
- set driver memory to 1 GB .
- enable event log.
- specify event log directory.
- set executor memory and cores to 21000 MB and 4 respectively.
- set number of cpus per task to 1.
Documentation about how to create a SparkContext and set various properties is available here.
- Your script should execute the query 3 times:
- First, you run the query without any RDD persistence.
- Second, you re-run the query when the input table RDDs are persisted.
- Third, you re-run the query when the output is also persisted.
For your report you should:
- Report the query completion time under the three different scenarios.
- Compute the amount of network/storage read/write bandwidth used during the query lifetime under the three different scenarios.
- Compute the number of tasks for every execution.
- Attach the script and present / reason about your findings for the above questions.
Note that for this question, you can use the sql method provided by SqlContext or HiveContext.
Question3
The goal here is for you to write a query using the SPARK API that, given two tables, will
generate a specific output. You will run the query using spark-submit. Note that your script
should not use a SqlContext or a HiveContext.
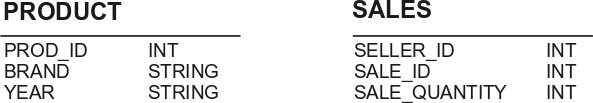
Figure below shows you the two tables involved in the query. The output of your script should contain: the names of the first five products which had the best sales, sorted in descending order and it should be persisted as a single file in HDFS.
When you write your script, you can use the same values for the SPARK properties as for Question2.
You need to copy the input data provided (product.txt, sales.txt) into HDFS and load it into your script.
For your report you should attach the script generated for the query.
Deliverables
You should provide a brief write-up (single column) with your answers to the questions listed above. In addition, you should attach your source files used for questions 2 and 3.
You should submit a group-X.tar.gz archive, by placing it in your assign2 hand-in directory for the course: ~cs838-3/assign2.
Clarifications
- You should always operate using ubuntu user by default. Use root permissions only when needed.