Summary
| Understanding |
Ideation |
Design |
Prototyping |
Evaluation |
Final Solution |
Ideation |
The Early Design Process |
Affinity Diagram
Our first step in developing ideas was to catalogue the various insights we received from our cultural probes. Our affinity diagram was essentially the same data as what we got from our users. We grouped each of their ideas on a white board, and came up with the following:
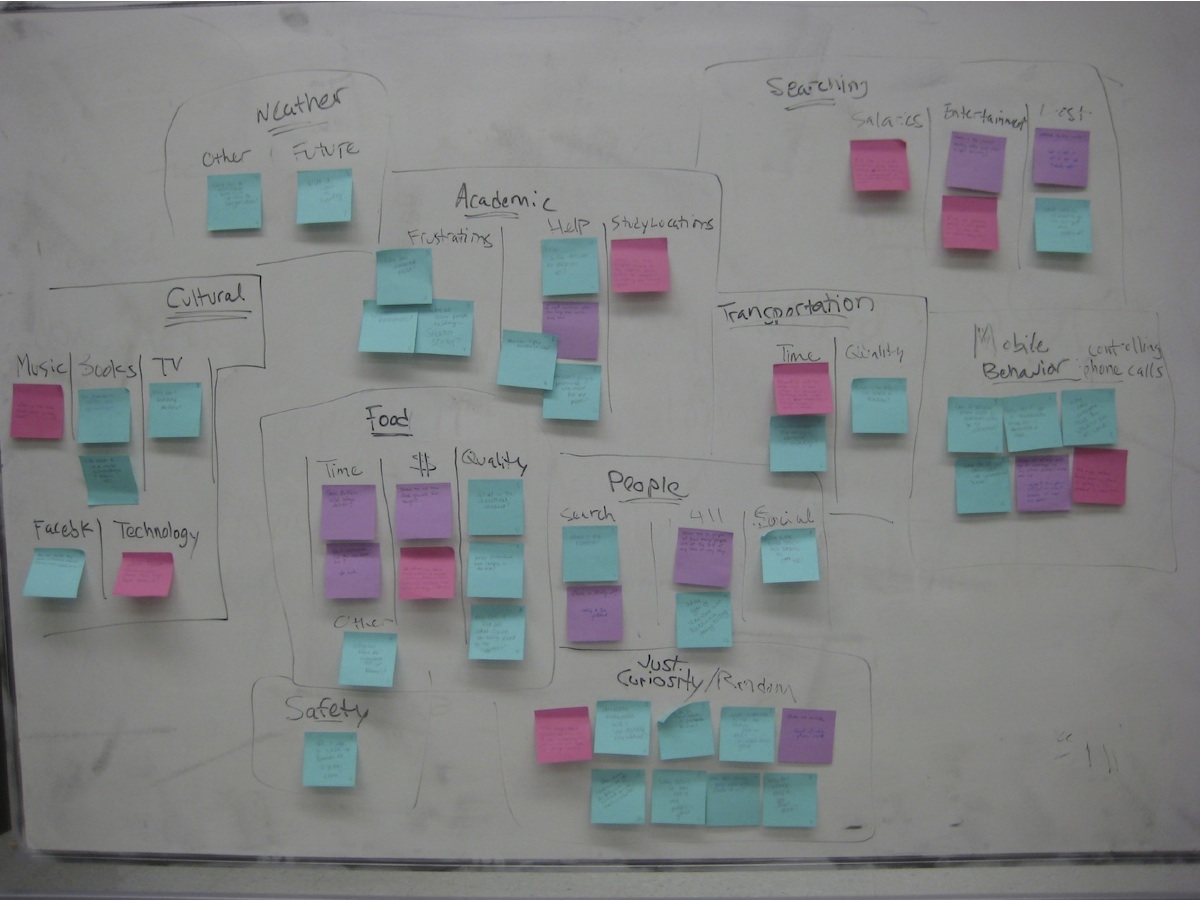
Some of the affinity groups we found were:
- Cultural: Movies, Books, TV...
- Food: Time, Money, Quality
- People: Search, Social
- Just Curiosity/Random
- Mobile Behavior
- Transportation
- Academic
- Searching
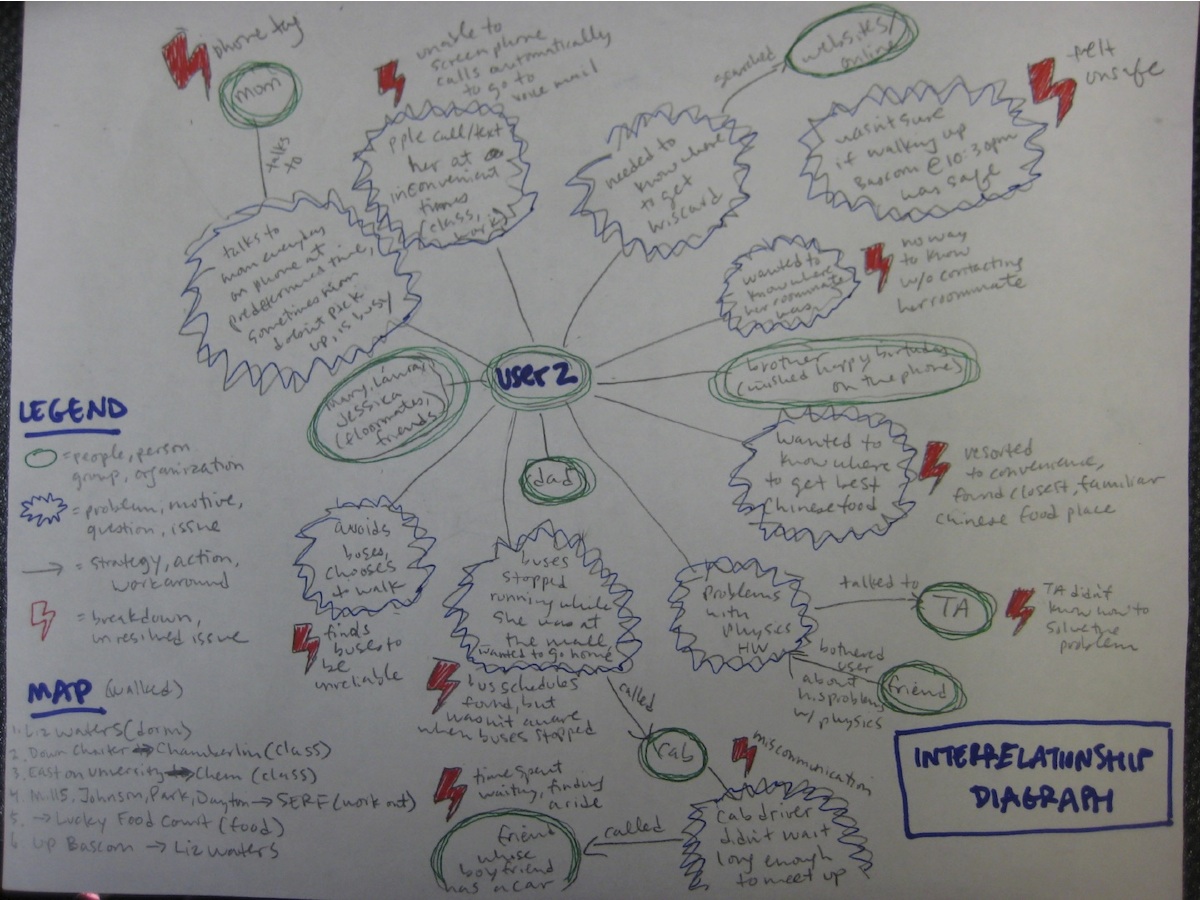
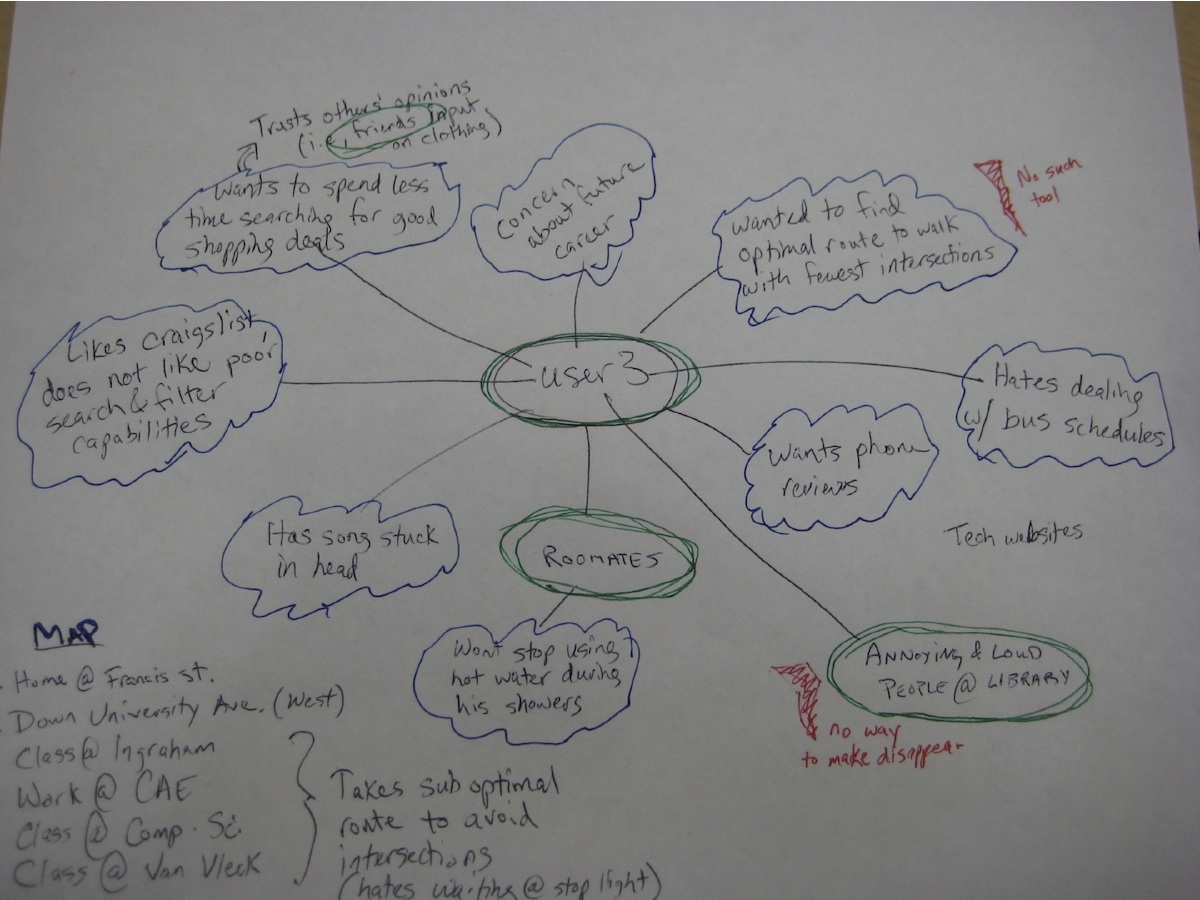
Digraphs
To get a sense of our users' needs and problems, we took the feedback from the cultural probes and assembled interrelationship digraphs -- diagrams which detailed the relationships between users, their problems, and other people.