New Session
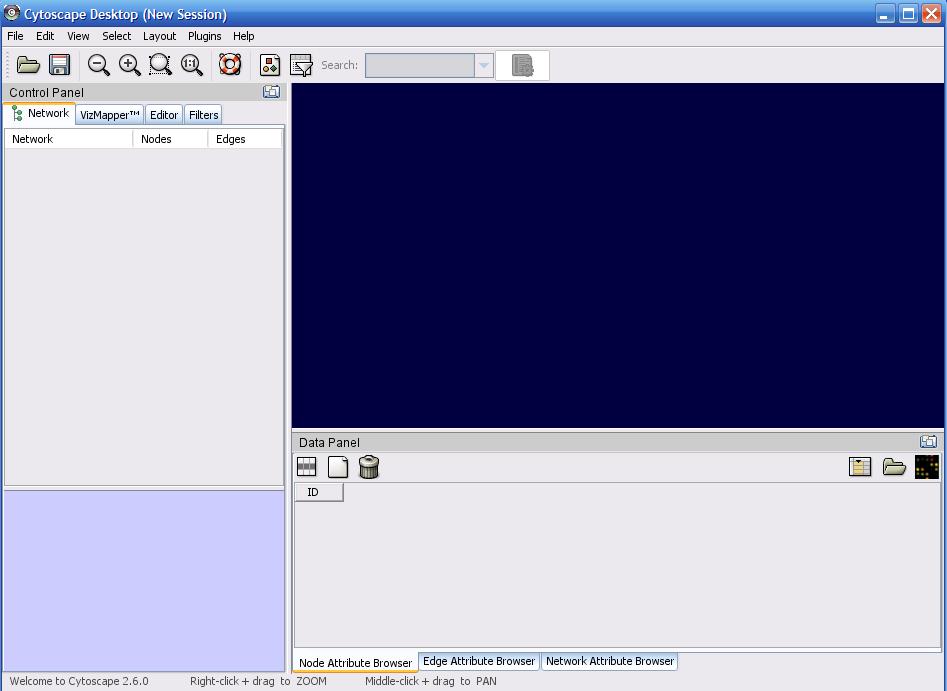 After launching CS, you should see a few things. The blue area on the right is where your data is
visualized. The left side is the Control Panel, and has 4 basic tabs:
After launching CS, you should see a few things. The blue area on the right is where your data is
visualized. The left side is the Control Panel, and has 4 basic tabs:
- Network is where you will be able to click on the various imported data networks
- VizMapper allows for customization of the appearance of your data
- Editor allows your to create/modify the existing network via edge and node addition/modification
- Filters allows for creating selections based off of attributes
The bottom side contains the Data Panel, which will display attributes of anything selected on the screen. There are 3 tabs underneath this. Node Attribute Browser shows you only information about the current nodes selected. Edge Attribute Browser shows your information about the edges selected. The last tab is not useful ( I haven't seen it 'do' anything ).
Loading Your Data
↵ Back To Top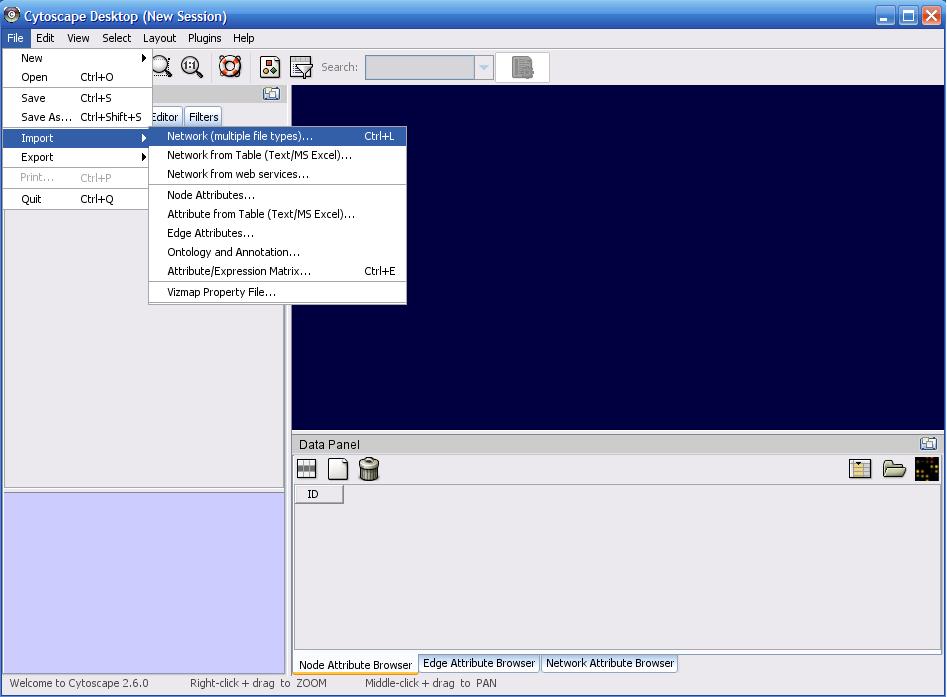
You downloaded this program to see something interesting in your data, so let's load it in and get started. Click on 'File' at the top, mouse over 'Import' and then click the first element "Network (multiple file types)". In the 'Import Network' popup, click on 'Select' and browse your filesystem for the file you wish to import ( Note: you can import multiple files at a time via ctrl + clicking on multiple files in a folder ). After you've selected the files, click on 'Open' to begin the import process. For SBML imports, see the next section explaining the following sequence of popups.
Enhanced SBML Import
↵ Back To TopIf you are using my SBML2 plugin, then you will see a few additional popups before all of the data is loaded into CS. This is to provide a better visualization experience, and was customized for Bioinformatic research at the University of Wisconsin-Madison. ( Note: A future version will eliminate popups and do a straightforward load. There will be a property option 'Edit' -> Preferences -> Properties which can be adjusted to do this automatic load or a customized load. It should be called 'enhancedSBML'. The following explanation is for the customized load. )
So you have just clicked on 'Open' and have been prompted with a Metabolite Filter dialog. There is a file in your /plugins directory called 'metabolitelist.exclude' It contains the names of metabolites you do not wish CS to load into your visualization. Clicking Yes will filter these out. ( You can add to the names in this file by opening it in Word or Notepad and typing in the names as they appear in your data file of ones you do not wish to load in. This file can be modified at any time. ) Clicking No will load in the data as usual. Click No for now.
Next is a similar popup. This one will trim any edges from a node, giving you just the node. This is useful if you still want CS to load in something, but don't want lots of edges connecting it to other nodes. Doing this will reduce clutter and give you a better visualization. This file can be edited in the same manner as the previous one. Click No for now.
The Main Network Map dialog asks what you would like to see within the main network that is loaded. This pertains to any genetic information which may be contained within your data. The first option will load Genes Reactions and Metabolites, the second Genes Proteins Reactions and Metabolites, the third option will just load in Reactions and Metabolites ( this is standard ), and by closing the dialog ( the red X in the top right ) no genetic information will be loaded in any map. Click 'Rxns and Met.' for now.
Now you should notice that CS just loaded in your first network. If your data has information about reaction subsystems, you will be prompted to load in extra networks now. The list of unselected subsystems is seen on the left. You can click on any of these subsystems, click 'Add' and they will be moved to the right. Any subsystem on the right will be loaded when you click 'Done'. If you accidentally added a subsystem before you clicked done, you can select it and click 'Remove'. Note that you can add and remove multiple subsystems simultaneously by ctrl + clicking or shift + clicking. The network titled 'GPR' is one created using any genetic data in the file. It contains Genes Proteins and Reactions, and shows the correct relationship between them. This network will not be on the list if you closed the previous dialog popup, or if there is no genetic information in the file. Add this network now if it is present. Once you have the desired subsystems on the right, click Done.
Next is a Network Filter tool. It allows you to get rid of any nodes that you do not want in your networks. This is an additional filtering tool that can be used instead of the first from-file metod. It is useful if you realize that there is something you do not want in several of your networks. On the left you see the Node Bank List sorted alphabetically. You can select and add these to the Filter list via the same method as the previous popup. Once you have the desired nodes to filter with, you simply click on the network or networks in the Network List, and click 'Filter'. This will immediately get rid of the nodes in the selected Networks. If you want to filter networks differently, that is, if you want different nodes removed from separate networks, then you can click on the 'Clear' button to remove all nodes from the Filter List, and you can add new nodes for another filter. This process can be repeated as many times as desired, for whichever networks in the list. Note that all 'Filter' clicks are irreversible ( but not deleted from your data file!), and that by clicking 'Done' you will have completed all of the enhanced load options.
Congratulations, you have successfully created/added/filtered your first network(s)!
What To Do With A Loaded Network
The following are some useful things which can be done with any network.
Selection and the Data Panel
↵ Back To TopGiven that a network is present and you have nodes/edges on the screen, you can select them by left-clicking with the mouse, or by drag-clicking over an area. The nodes and edges should change to a different color signifying that they are selected. If you any nodes selected, you will see their ID name in a column in the Data Panel. You can adjust what attributes are visible by clicking the first button immediately under the words 'Data Panel'. This is the attribute selection browser, which lets you click on which things you would like to view in your Data Panel. Note that Node attributes are separate from Edge attributes, and that there are different ones for each. After you have selected the desired visible attributes, simply click outside of the browser and they will automatically appear with the data. These newly added Columns are adjustable, and can be removed by deselecting them from the attribute selection browser. All of the rows can be sorted by increasing or decreasing value according to the data from a column by clicking on the column name. Edge Attributes can be viewed by clicking on the Edge Attribute Browswer tab on the bottom of the Data Panel. You can manage attributes in the same manner as with nodes. Attributes can be created and deleted by clicking on either of the other two buttons next to the attribute selection button. Any data can be modified by clicking on the field and typing new values for it.
Click here for hi-res version download
Manipulating the Network View
↵ Back To TopYou can change your network view by a number of easy methods. Using the mouse, you can zoom in on data with the scroll wheel or pan by middle-clicking ( clicking the scroll wheel ) and dragging. Rotation and Scaling can be done by clicking on Layout -> Rotate or Layout -> Scale. A Tool Panel opens on the bottom left of the screen with options for rotation and scaling. To remove this panel from the display, go to Layout and click on the option which has the checkmark next to it.
Performing Automatic Layouts
↵ Back To Top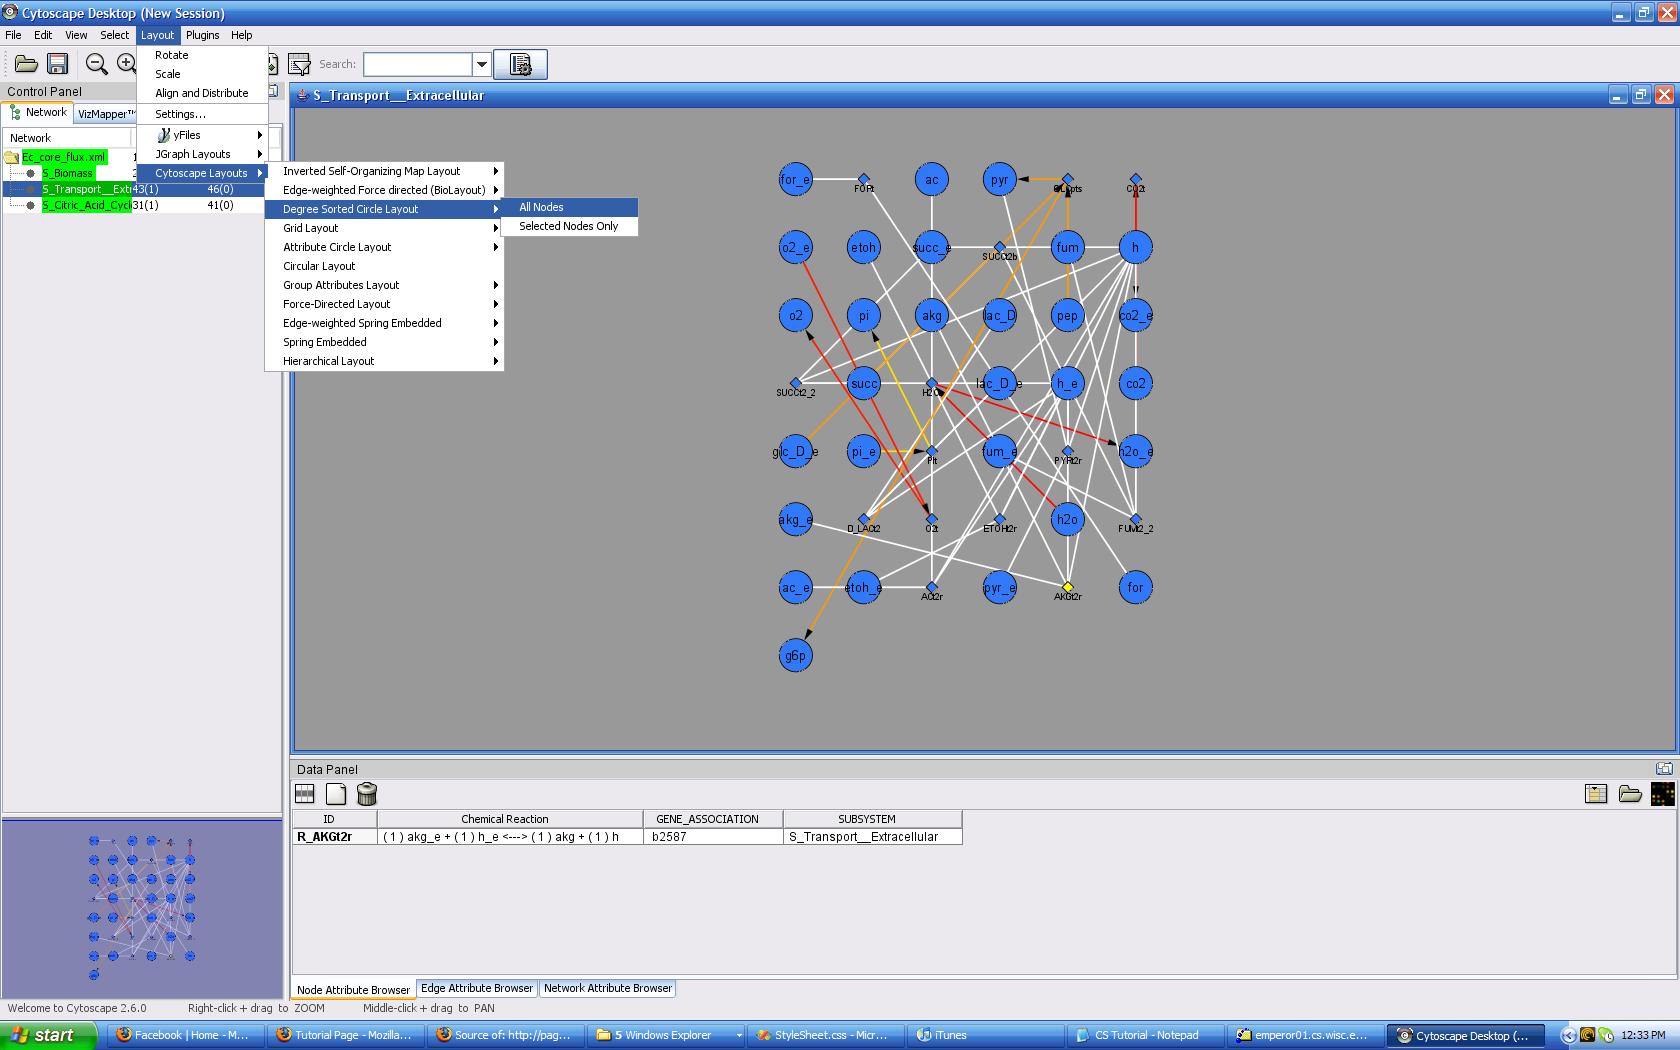
You may have noticed that the standard grid layout isn't doing much for your data. You wanted to visualize what was going on, and so there are various layout algorithms which will organize the data for you. Click on Layouts -> Cytoscape Layouts -> Degree Sorted Layout -> All Nodes. Yeah! You have just performed the rigor of calculating and associating nodes based on the number of edges coming from it, and graphically arranging them onto the screen! (or maybe the computer did that...) You can check out other layouts. Some are more useful than others, and the layout you choose is really based on what you are looking for. I recommend using any of the layouts besides JGraph Layouts because those seem to break, or not work consistently. Note that your visualization can be grouped by attribute using the Cytoscape Layouts -> Group Attributes Layout -> whichever attribute you are interested in seeing. Also, if your edges have any attributes associated with them, you can do special Force Directed Layouts which can use the numeric value of the attribute to do a spring-like physical-simulation-into-layout layout. This is useful for viewing network flow in a system.
Click here for hi-res version download
Performing Manual Layouts
↵ Back To TopAt any time, you can move your nodes on the screen if you don't like where they are. This is useful for tweaking the display after an automatic layout. Although the automatic is quick and painless, it also doesn't do exactly what you want ( probably ) so its likely you will want to make changes. To move a node, click on it and drag it somewhere else. Its that easy. If you want to move multiple nodes at a time, you can do the drag select to highlight an area, then click and drag on one of the selected nodes to move them all. Also, shift + clicking will multi-select them as well.