My work focuses on applying, measuring, and expanding our knowledge of perception to drive visualization design. I use this insight to design techniques that support accurate visual comparisons of large, complex data. Please click on a topic below for more information, including project summaries and links to publications. A complete list of publications can be found here.
|
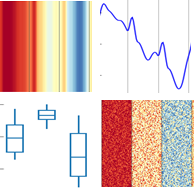
▾ Comparative Judgments for Aggregate Sequence Encodings
with Michael Correll, Steven Franconeri, & Michael Gleicher |


|
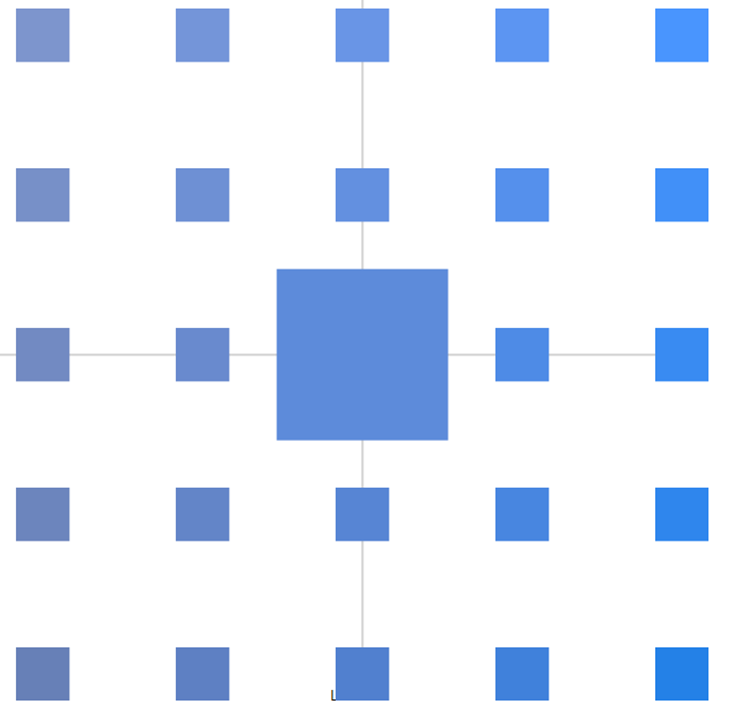
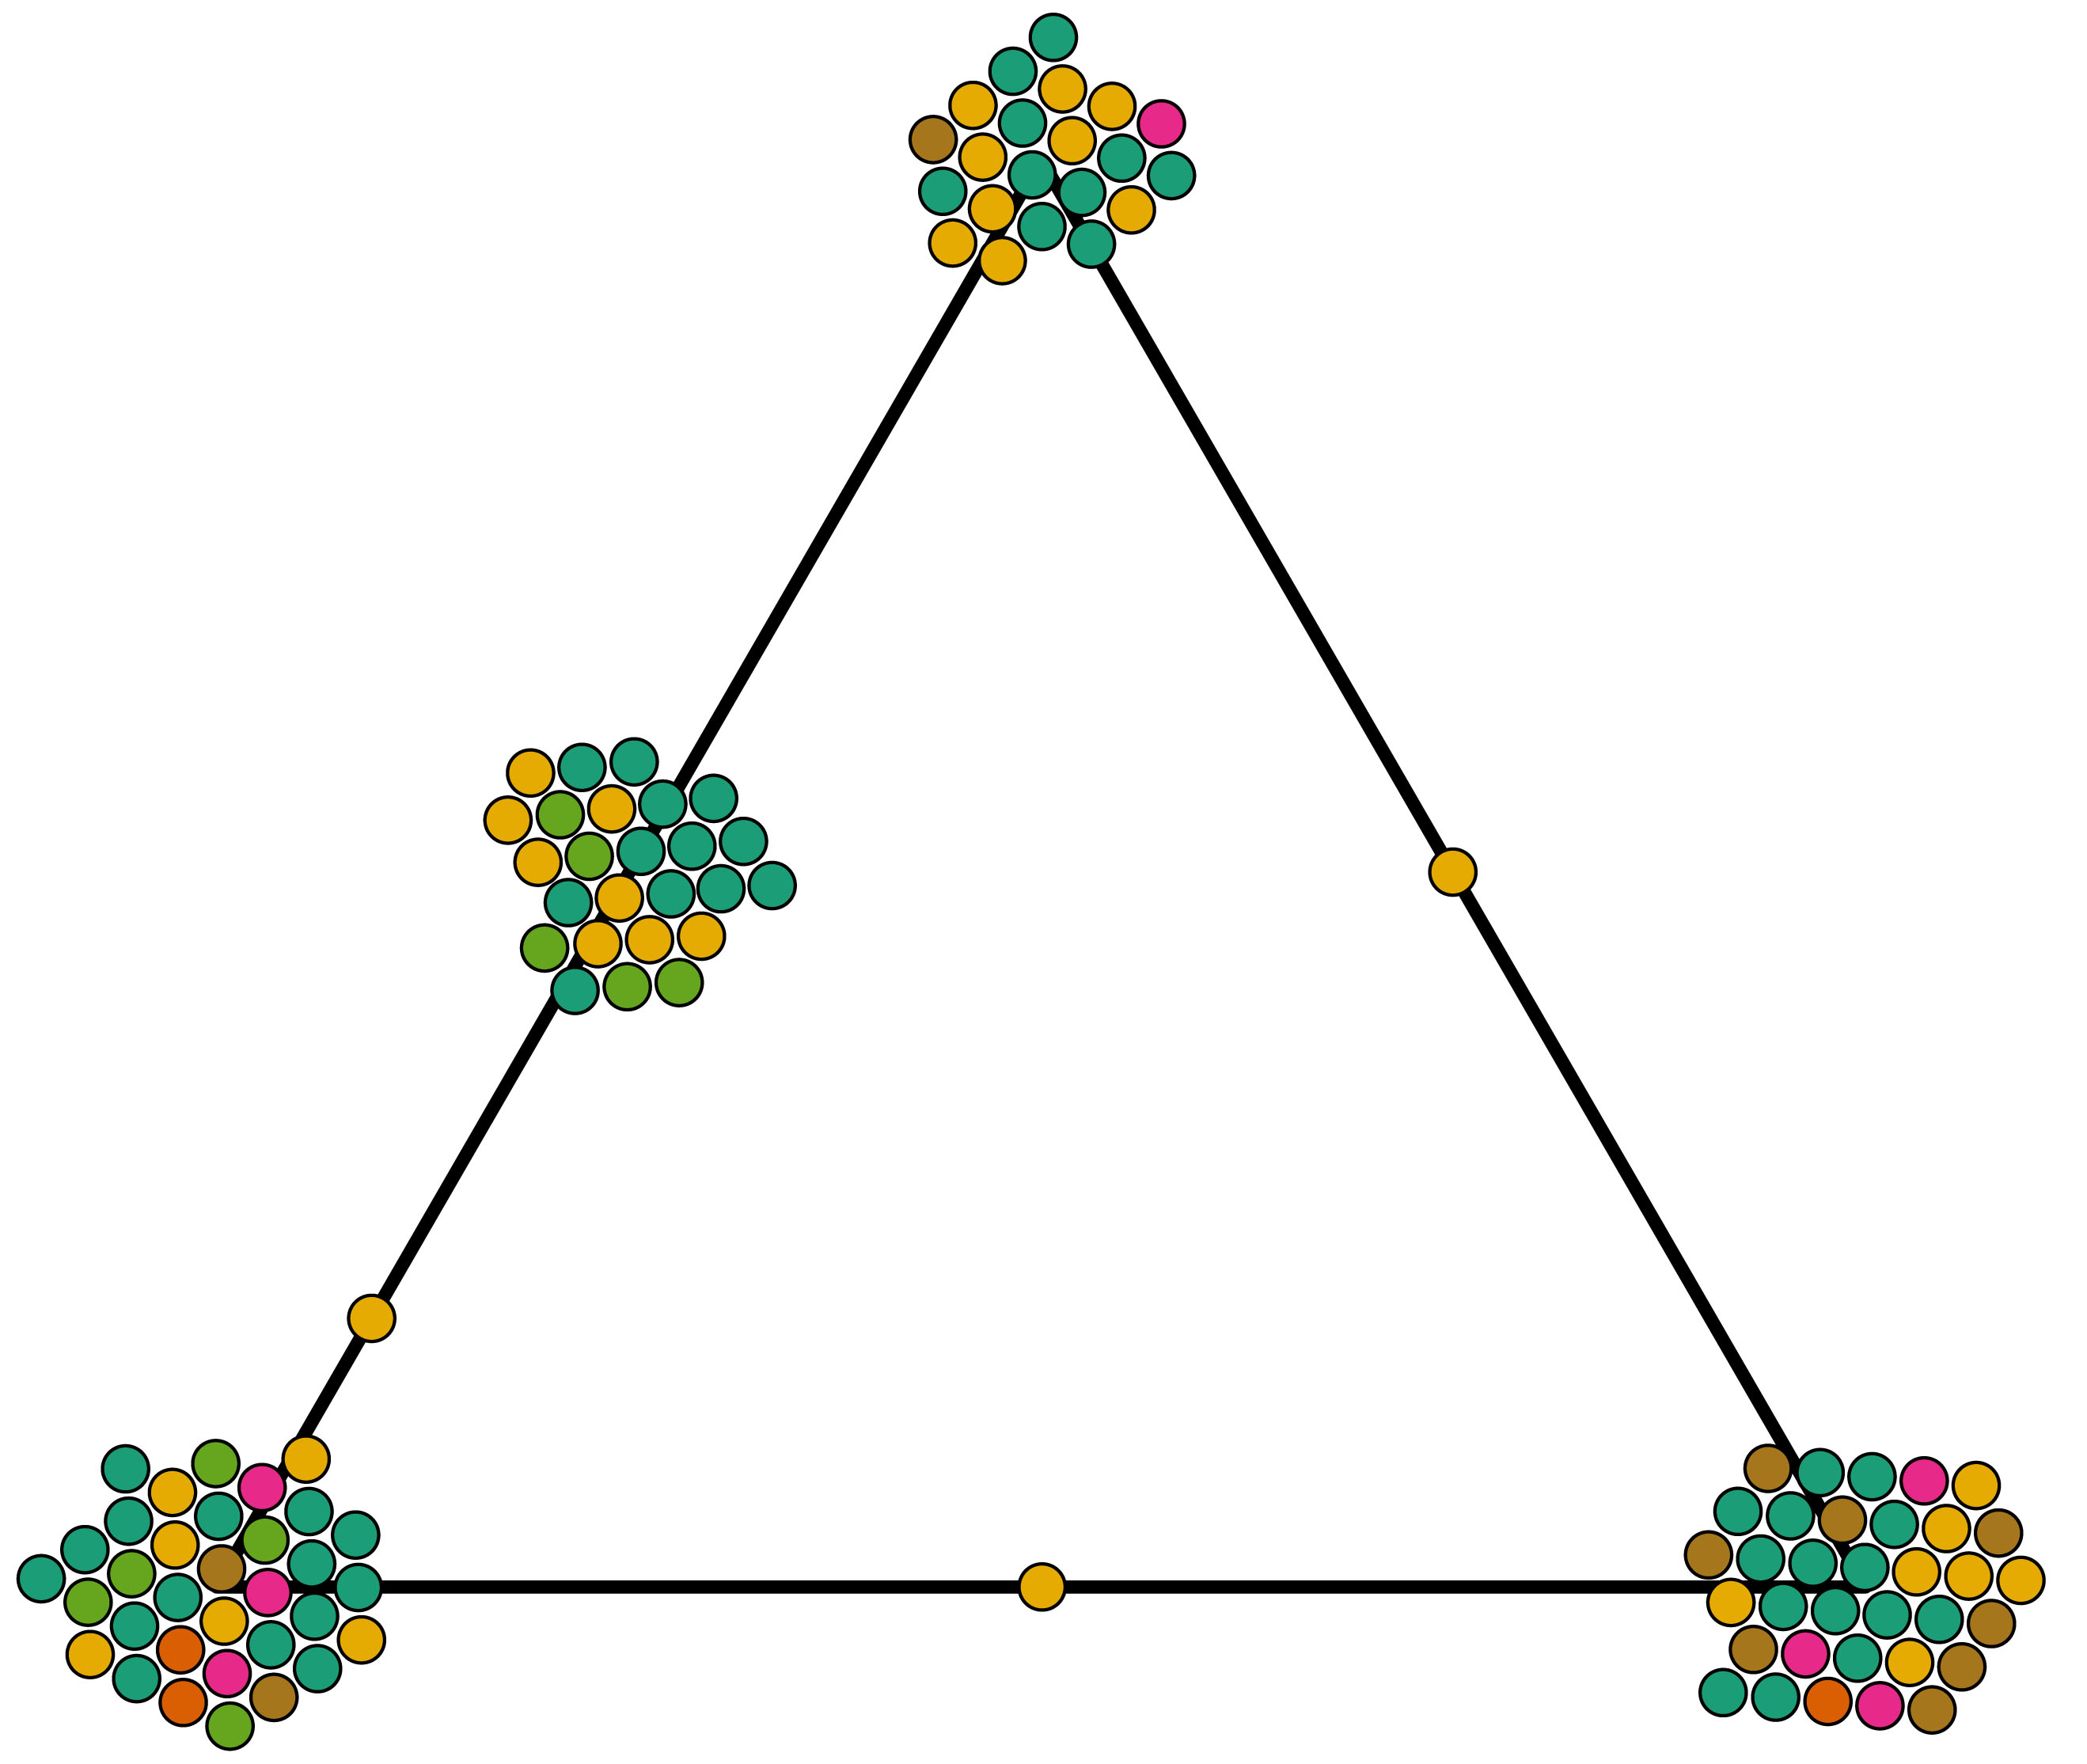
▾ Modeling Color Discriminability for Visualization Applications
with Maureen Stone, Vidya Setlur, & Michael Gleicher |
|
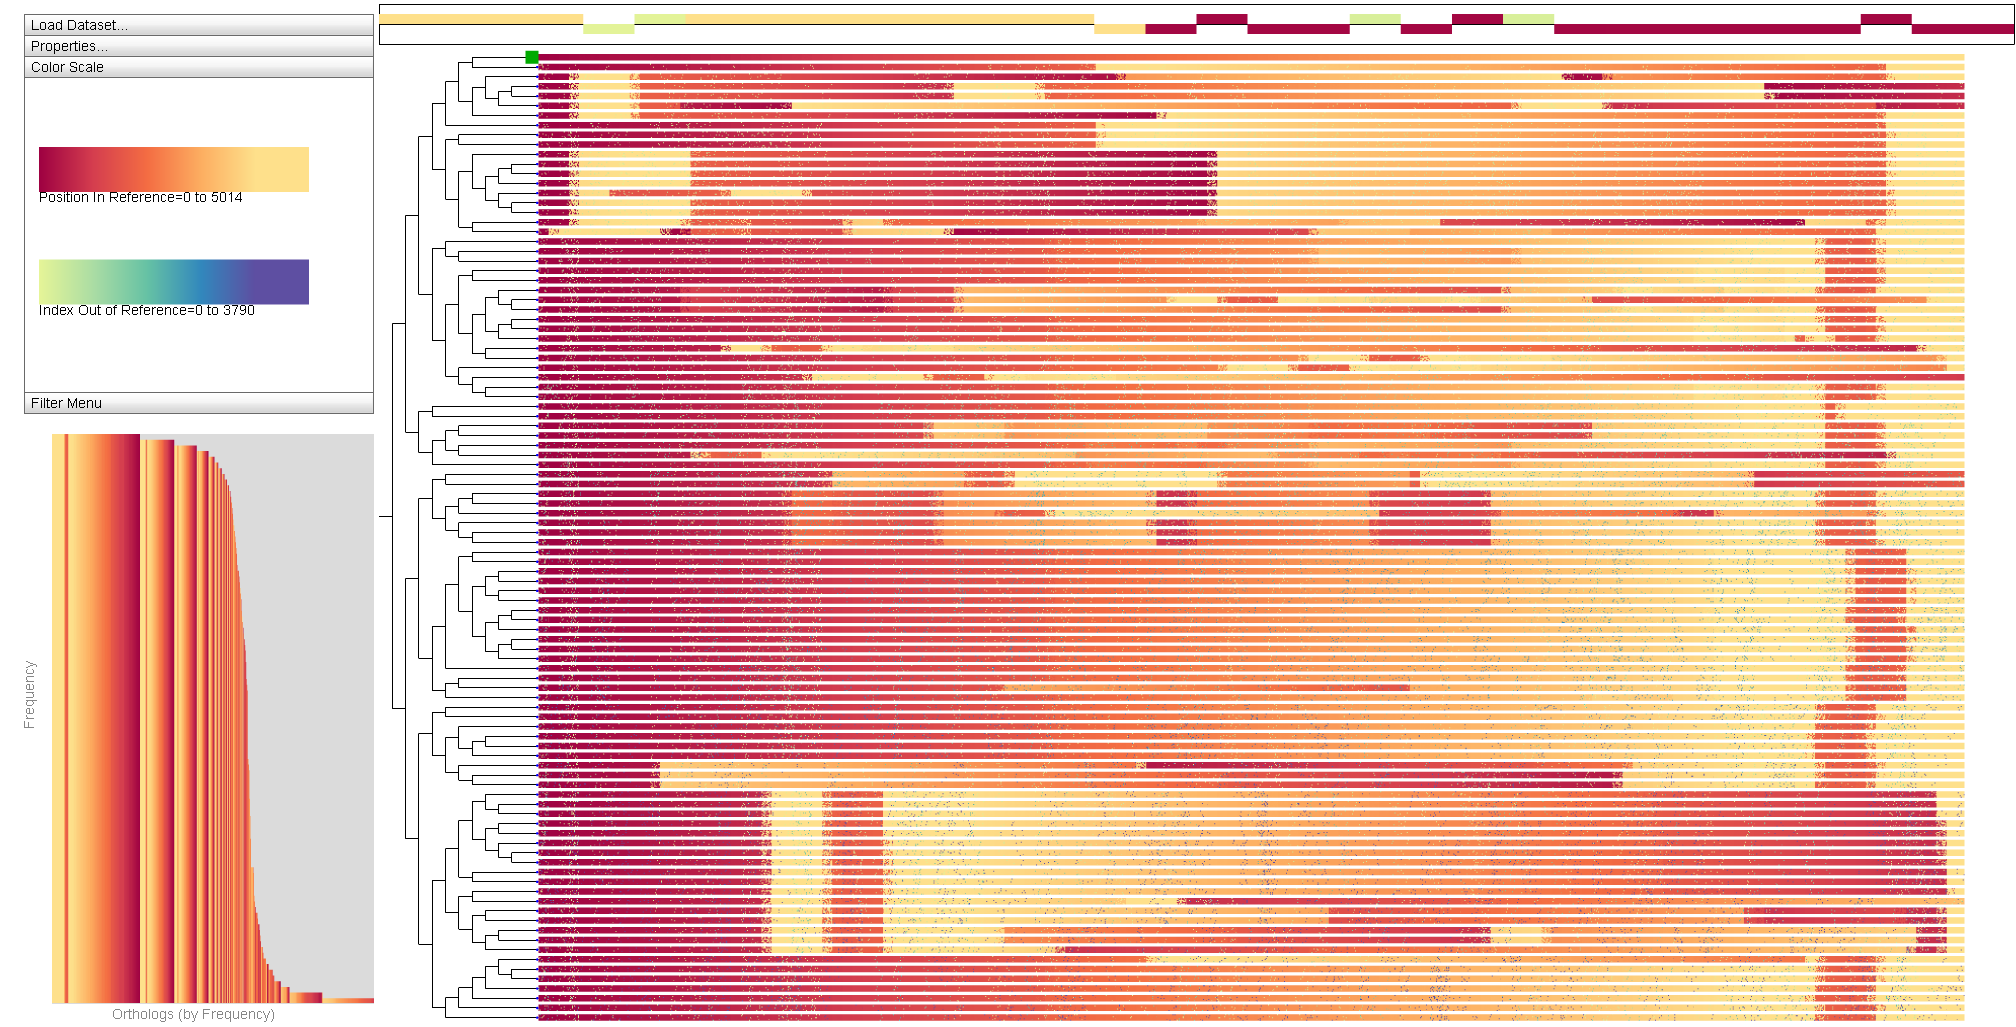
▾ Perceptually-Motivated Scalable Sequence Overviews
with Colin Dewey & Michael Gleicher |

|
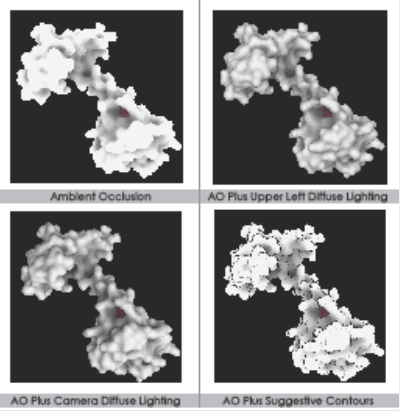
▾ Exploring Algorithmic Predictions for Molecular Surface Data
with Alper Sarikaya & Michael Gleicher |
|
▾ Visual Comparison for Information Visualization
with Rick Walker, Ilir Jusufi, Jonathon Roberts, Chuck Hansen, & Michael Gleicher |
