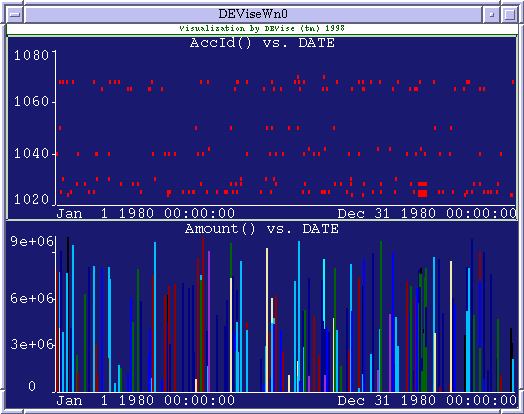

The top view (AccId vs. DATE) shows the account ID of each deposit on the Y axis, versus the date on the X axis.
The bottom view (Amount vs. DATE) shows the amount of each deposit on the Y axis, versus the date on the X axis. The color of each bar represents the account ID into which the deposit was made.
The two views are linked together on the X axis, so that if the user zooms in on a particular range of dates in one view, the other view will zoom to the same range of dates.