Consider the following code to plot the polynomial y = 2x6 - 12x4 + 2x3 - 4x2 + 15x + 50 for x values between -2.8 and 2.8
xx = -2.8 : 0.01 : 2.8;
yy = 2*xx.^6 - 12*xx.^4 + 2*xx.^3 - 4*xx.^2 +15*xx + 50;
plot(xx, yy)
MATLAB allows a more efficient representation / calculation:
Given data points (xk, yk), find a smooth function f(x) (e.g., to be able to find values between data data points).
Interpolation: f(xk) = yk for all k
Approximation: sum of the squares of the errors ( errork = f(xk) - yk) is minimized
Assume data points (xk, yk) have been put into variables xdata, ydata.
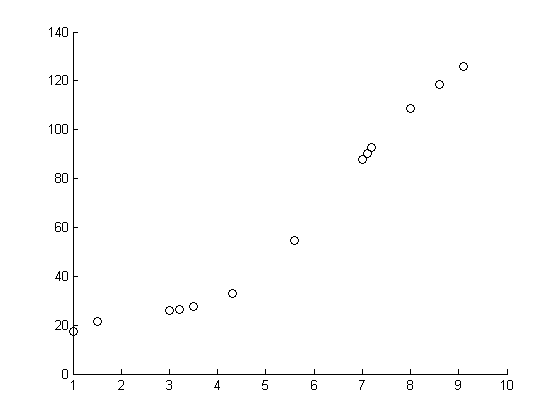
Example: fit xdata, ydata to the curve y = aebx
Idea: convert the curve to something that looks like a polynomial