Twitter Visualization
Nathan Moeller and Robert Sass
CS 534 Computational Photography—Fall 2013
Abstract
Twitter is fast becoming one of the largest sources for wide ranging data about what is currently going on in the world. Trending data can be used as an important source of what is happening in the world and what a wide swath of people are talking about, be it important topics such as news stories, or perhaps less crucial musings on pop culture. Unfortunately, most existing methods focus on an exclusively textual representation of this data. This project seeks to create a more interesting visual representation of this data by using various APIs to fetch Twitter trending data and corresponding images and then representing that data on a web page in an interesting way.
1. Introduction and Motivation
At the time of writing Twitter is the next big name in social networking. As shown by the excitement surrounding its recent IPO, it is clear that there are great expectations for its future growth. These expectations are well founded, as Twitter is currently the fastest growing social network in the world1. With over 200 million active users in total tweeting over 500 million times per day2 there have been at least 163 billion tweets since Twitter began in 20063. In all, what these numbers show is that Twitter holds the potential for a lot of interesting data to be gathered.
Using various algorithms, Twitter aggregates this mass of information into trends. These trends give valuable insight into what the millions of people who are Twitter users are thinking and talking about. At first glance, these trends may seem to simply be rather trivial reflections of current happenings in pop culture (although one could argue that this is a symptom of the relative priorities of Twitter’s users rather than any fault of Twitter). In other cases, however trends can prove to be powerful indicators of important news events before such events are reported by mainstream media outlets. In the same vein these trends can reveal important movements largely organized through Twitter and other social media sources such as the 2011 Egyptian Revolution. Twitter’s massive collection of data organized into trends can thus reveal important happenings around the world.
The main problem with Twitter trends, however, is that they are primarily textual in nature. When one clicks on a given trend they are brought to a Twitter page representing that trend as seen in Figure 1. The figure shows Twitter pictures related to the trend followed by relevant tweets. What this project seeks to do is visually represent the top ten trends together as a group with images that better represent the content of the trend than the pictures on Twitter do. This collective representation provides a better view of the whole picture of what is going on in the world. This combined, visual view provides a much better and more interesting representation of the relevant data than a simple list of text.

2. Problem Statement
This project seeks to take the top trending data from Twitter and represent it in an interesting visual way on a web page.
3. Related Work
As far as the authors could find there is not anything that quite provides the same representation of the data that this project does. One interesting alternative, and one of the inspirations for this project comes from a website called Trendsmap4. Trendsmap overlays a world map with textual representations of top trending data in their corresponding locations (Twitter provides data that is trending in locations specified by a Yahoo! WOEID, or Where on Earth IDentifier). The map works fairly well for zoomed in locations as shown in Figure 2, but when one zooms out as in Figure 3 it begins to look quite messy. The map concept is a good idea, but by simply using the textual forms of the trending data, this implementation provides a less useful/interesting representation of the relevant data. This current project seeks to follow the same ideas of aggregation and representation but in a more visually pleasing form.
Figure 1
Or so they say. This weekend, Dazed flew out to Lagos, Nigeria for the third annual MTV Africa Music.
Awards and spent a few days and some late nights meeting rap, R&B and kuduro superstars from across Africa: names like Banky W, Fally Ipupa, Daddy Owen, Cabo Snoop and Radio & Weasel, from Angola to Uganda, Democratic Republic of Congo and beyond, all huge stars in their own countries, selling truckloads of records despite rampant piracy and a rickety music industry. These guys are kind of the Jay Zs and Snoops of Africa, basically.
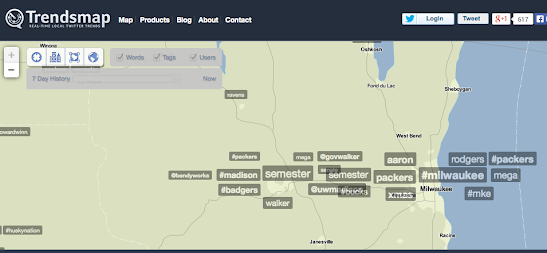
Figure 2--clean zoomed in results from Trendsmap
Awards and spent a few days and some late nights meeting rap, R&B and kuduro superstars from across Africa: names like Banky W, Fally Ipupa, Daddy Owen, Cabo Snoop and Radio & Weasel, from Angola to Uganda, Democratic Republic of Congo and beyond, all huge stars in their own countries, selling truckloads of records despite rampant piracy and a rickety music industry. These guys are kind of the Jay Zs and Snoops of Africa, basically.
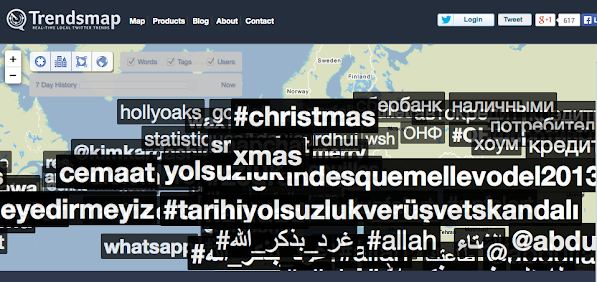
Figure 3--messy zoomed out results from Trendsmap
Or so they say. This weekend, Dazed flew out to Lagos, Nigeria for the third annual MTV Africa Music.
Awards and spent a few days and some late nights meeting rap, R&B and kuduro superstars from across Africa: names like Banky W, Fally Ipupa, Daddy Owen, Cabo Snoop and Radio & Weasel, from Angola to Uganda, Democratic Republic of Congo and beyond, all huge stars in their own countries, selling truckloads of records despite rampant piracy and a rickety music industry. These guys are kind of the Jay Zs and Snoops of Africa, basically.
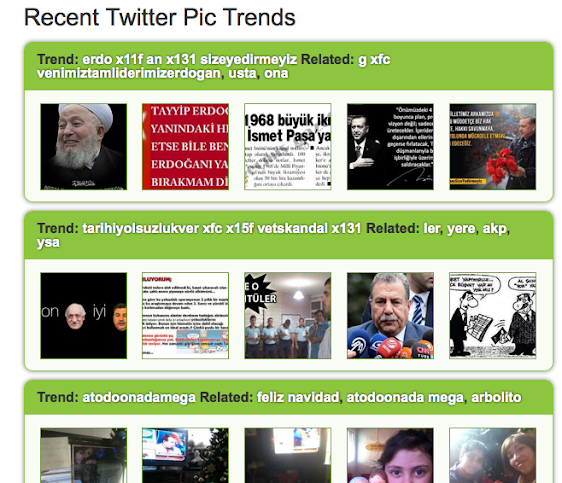
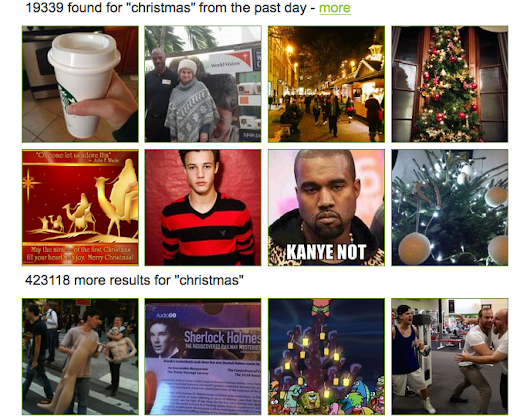
A slightly different approach comes from another website named Twicsy5. Twicsy is basically a search engine for pictures uploaded to Twitter. Its front page provides a list of recent “pic trends” as well as corresponding pictures to match those trends as seen in Figure 4. Twicsy ultimately takes a slightly different approach than this current project for several reasons. First, the main objective of Twicsy seems to be to find relevant images from Twitter based on a given search term. As a result the resulting images from the top trends seen on the main page are not the main focus as they are in the current project. Additionally Twicsy uses images from Twitter itself that are not as representative of the content of the trends as images from other sources as can be seen by a search for “Christmas” in Figure 5.
4. Theory
The main idea behind this project’s implementation is to use the Twitter API to collect the current top ten trends for a specified location and then use that data to collect relevant images to display on a web page in an interesting way.
One important decision that had to be made was what to do with hashtags. Twitter collects trending data in two different ways. One way is that their algorithm parses through tweet content looking for common keywords that it groups into “normal” trends. The other source of trends comes from hashtags (i.e. #Christmas) that individual users use to tag the content of their tweets. The Twitter API allows for either including or ignoring hashtags in the data that it returns. The primary issue with using hashtags is that they are harder to find images for. Hashtags by nature only consist of a single word so many of them end up being a long single strings such as #SuperBowlRun (to use one of the top trends at the time of writing) which could potentially cause issues in searching for images. This fortunately turned out to be not much of a problem as our source for images, Bing image search, ended up separating the words in most cases. The other problem is that, as users supply them explicitly, hashtags do not naturally always make the most sense in image form and thus can potentially return either unrelated or no results. In the end there seems to be a trade-off between including as many trends as possible and best representing the scope of the data by including hashtags, and provided a somewhat better looking result that limits the total trends by excluding hashtags. Ultimately this project does not include hashtags in the results in order to provide a more coherent representation.
The other important decision that had to be made was where to get the resulting images. The first and perhaps most obvious suggestion would be to get the images from Twitter itself. Twitter images ultimately were rejected for a two main reasons. The first reason is that the Twitter API does not lend itself for simple access to Twitter images and would thus make this project much more complicated. The second reason has to do with the nature of images uploaded to Twitter. The problem arises from the fact that it is Twitter users who are doing the uploading of the images. Twitter images fundamentally exist as a means of social interaction, not accurate visual representation. Therefore a better source must be used to accurately portray the actual content of the trending data. Furthermore it is the users who are tagging the image content, a dubious source for the accuracy of those tags as can be seen in the previous examples from Twicsy. Ultimately it was decided that the Twitter users could not be trusted to provided satisfactory image results and that this project had to look elsewhere.
The second place evaluated as a potential image source was Flickr which has a much more accessible API for gathering images. Ultimately, however, Flickr suffers from many of the same flaws that Twitter does. As Flickr is also essentially a social media site its images were plagued by many of the same issues regarding content and tagging. Additionally, Flickr is not able to handle the combined word hashtag queries and as a result if Flickr had been used, hashtag results would have to be omitted regardless.
In the end the solution that this project arrived on was to use Bing image search. Bing, unlike other potential image search engines such as Google, has a very developer friendly API that makes image collection much less complicated. Image results from Bing also seem to be much more relevant than those found on Twitter and Flickr. All in all, it was decided that Bing provided for the best possible visual representation of the content of Twitter’s trending data.
5. Method
Our project is broken up into two main files, getBingImages.php and trendingTopics.php. One file (getBingImages.php) is the server side component, and the other (trendingTopics.php) is the display portion. Each file is written in a combination of PHP, HTML, Javascript and jQuery.
trendingTopics.php is the webpage, so that is the page that the user requests in the browser. When a user navigates to our site, the first thing that happens is the display file determines the location. If a location has been set by the on-page form, then the location ID is set to a variable called $locID. It will otherwise default to the location ID of the United States (the United States was chosen rather than worldwide to prevent foreign language trends that could potentially return no results). The code is shown here (lines 2-7).
if(isset($_POST['locID'])){
$locID = $_POST['locID'];
}
else{
$locID = 23424977; //defaults to United States
}
Next, trendingTopics.php will run a script to get the image data. The data is obtained in a request called getJSON(). The getJSON() function calls our server component, getBingImages.php (line 30). The first thing that our server component will do is set up our Twitter settings to properly use the Twitter API (lines 3-9 of getBingImages.php). Next, we use the Twitter API to download the trending topics given the location. We decided to exclude hashtags, but our program will still work if hashtags were included. This is seen in the code below (lines 14-25):
$url = 'https://api.twitter.com/1.1/trends/place.json';
$locID = $_GET['locID'];
$getfield = '?id=' . $locID . '&exclude=hashtags';
$requestMethod = 'GET';
$twitter = new TwitterAPIExchange($settings);
$response = $twitter->setGetfield($getfield)->buildOauth($url, $requestMethod)->performRequest();
$data = json_decode($response);
for($i = 0; $i < sizeof($data[0]->trends); $i++){
$trend = $data[0]->trends[$i]->name;
array_push($trends, $trend);
}
This piece of code puts all of the trends into and array called $trends. Finally, using the Bing API we loop through each trend and do a Bing image search (lines 36-82). This is the majority of the code. The code will construct an array of datapoints, each of the following format:
[[“Topic1”, http://urlTopic1.com],[“Topic2”, http://urlTopic2.com]]
The JSON Object is then printed for use in trendingTopics.php. In trendingTopics.php, a jQuery foreach loop is used to loop through each topic and corresponding image url. The call is as follows:
$.each(result, function(i, image)
In the above code, image[0] is the trending topic, and image[1] is the url. Within the loop, a switch statement is run to determine what position in the below HTML the photo will be assigned to. There is no order to this statement, and it simply put the first image in spot 1, second in spot 2, etc. (lines 31-76). jQuery is used to replace the current images with the supplied image, and to replace the default caption of “Unknown” with the trending topic. Example code:
$("#first").attr("src", image[1]);
$("#firstCaption").attr("data-caption", image[0]);
Finally, after all of the images have been put in a corresponding spot, the collage() method is called and the collage API we are using is run. Before this happens though a ten second timer is run to make sure all of the images are loaded. This is necessary because the getJSON() method call is an asynchronous loop, which means the rest of the page will load while getJSON is still running. This causes a problem in our code because it will try to use a trending topic that has not been seen yet, thus the need for a ten second delay. The rest of the code is HTML and PHP that organizes the images and creates the PHP form to change the location. (lines 116-199)
6. Experimental Results
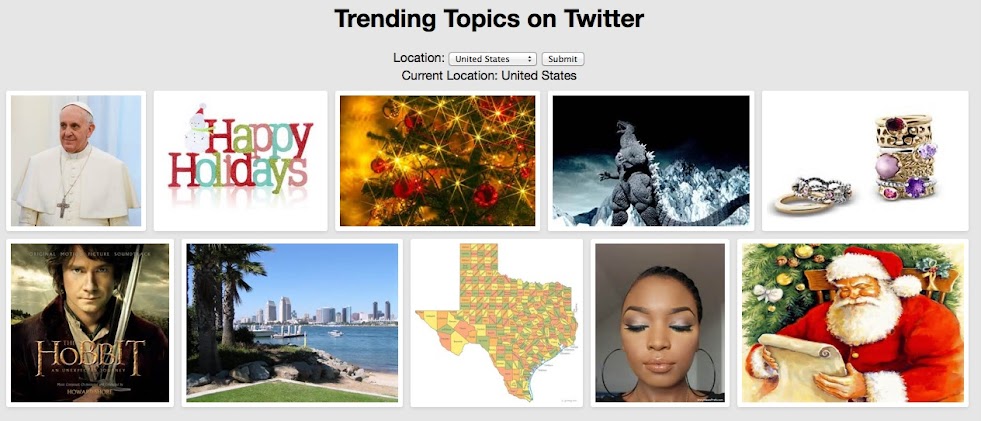
Screenshot taken on 12/11/13 with location United States, hashtags omitted.
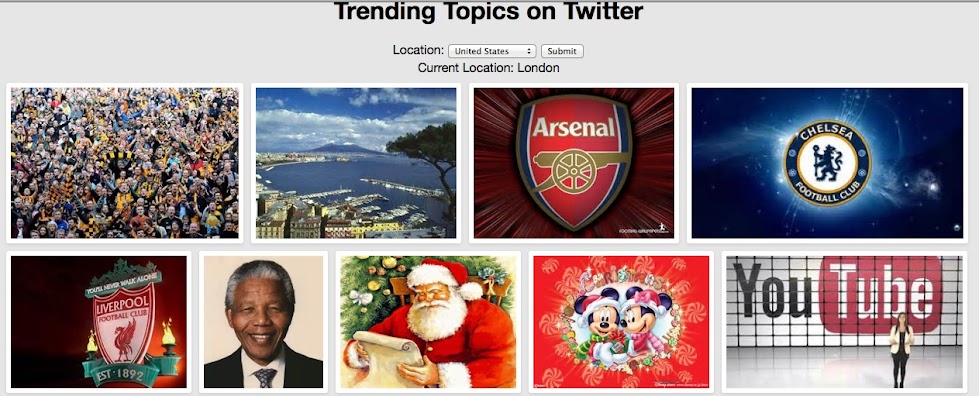
Screenshot taken on 12/11/13, location London, UK, hashtags omitted. This is an interesting result because it shows the importance of location with the prevalence of soccer related pictures seen here, something that would certainly not show up in US trends.
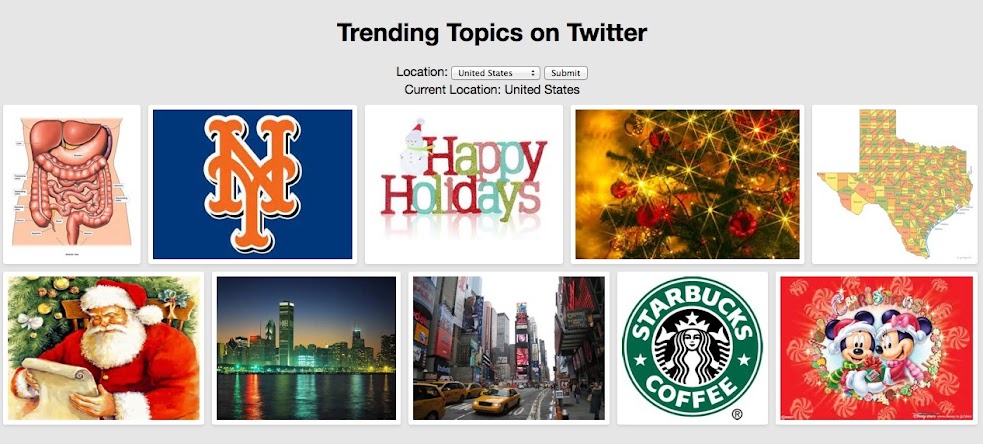
Screenshot taken on 12/11/13, location United States, hashtags omitted. This is an example of a potential “failure” case. At the time one of the trending topics was Colon following the New York Mets’, as seen by their logo, signing of pitcher Bartolo Colón. Because of the spelling, the top Bing image result was a picture of a colon as seen by the upper left picture. The method still works, but the representation of trends is not entirely accurate.

Screenshot taken on 12/17/13, location United States, hashtags included. This result shows a problem with the inclusion of hashtags. The soccer ball on the bottom right is a placeholder image and its presence shows that there was a topic that returned no results, likely a hashtag in this case. This result also shows the mouse hover operation of displaying the trend over the image as seen on the Christmas photo.
7. Concluding Remarks
For the most part, this project produces satisfactory results for the problem of providing an accurate representation of Twitter trending data. Twitter is a tremendous source for getting the pulse of what its millions of users are thinking and talking about and this project provides an interesting way to visually represent that data. By using an actual image search engine in Bing rather than more socially oriented photo sites such as Twitter or Flickr, the representation is an accurate depiction of the actual content of these trends.
Possible future extensions could include adding more images to the page without hampering performance, further manipulation and cohesion of the images beyond the present grid layout, and a way to automatically refresh the images/trends without refreshing the page.
8. References
1http://blog.globalwebindex.net/twitter-now-the-fastest-growing-social-platform-in-the-world/
2http://www.telegraph.co.uk/technology/twitter/9945505/Twitter-in-numbers.html
3http://diegobasch.com/some-fresh-twitter-stats-as-of-july-2012
4http://trendsmap.com/
5http://twicsy.com/