 no-culling.mpeg (961KB)
 This work is described by a paper which appeared at the 1997 Symposium on Interactive 3D Graphics. The slides for the presentation at that conference are available also (in Powerpoint 4.0 format).
no-culling.mpeg (961KB)
In complex dynamic environments, a large of part the time for each frame is used in updating dynamic state. In the ideal case, no time would be spent updating systems that are not in view. However, if an object is not updated, we must somehow generate a new, consistent state when it comes back into view. The research here is concerned with techniques for rapidly generating new dynamic state as objects move into and out of view.
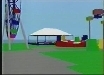
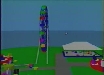
The trivial solution is to completely solve for the behavior of the system from the time it was last visible to the time it re-enters the view. This causes extreme lag, as can be observed in the video clip provided (no-culling.mpeg). In this scene, we are trying to maintain a constant frame rate. The large lag times and severe view jumps associated with the bumper cars are a direct result of the dynamics catching up. The lag only becomes worse as the objects are out of view for a longer period of time. Clearly, this is not the way to proceed.
 octopus-example.mpeg (530KB)
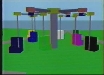
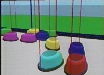
Here we present an alternate solution to the problem of updating to a consistent state. Consider the octopus ride shown in this clip: octopus-example.mpeg. This ride consists of large rotating beams that have secondary beams attached at the ends. Both the primary and secondary beams are driven while the cars (seats) are free to rotate. When the octopus is steadily running, it is very difficult to predict the future behavior of a given car. If the ride has been out of view and the new state is not directly derived from the last known state, then the viewer is unable to detect an inconsistency.
On the other hand, cars tend to behave in certain ways. For example, they almost always face outward as they pass closest to the viewer (see clip). If the object appears inconsistent with such tendencies, the viewer may detect a problem. The key to our techniques is to capture the quality of the behavior as statistical distributions or function approximations, and then generate new states consistent with such information.
To build a model of the ride's behavior, we take large number of samples of the object's state over time. In this case, the state consists of two angles, theta and phi, and the angular velocity, phi-dot. Plotting these samples leads to the following image, which is a 2-D, theta=0, slice of the 3-D distribution representing the state of the object for any time.
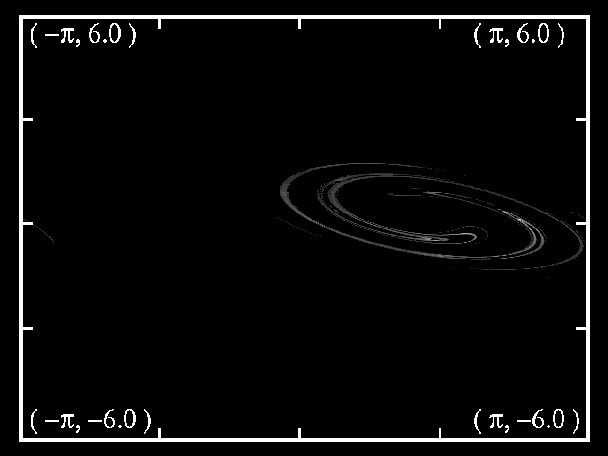
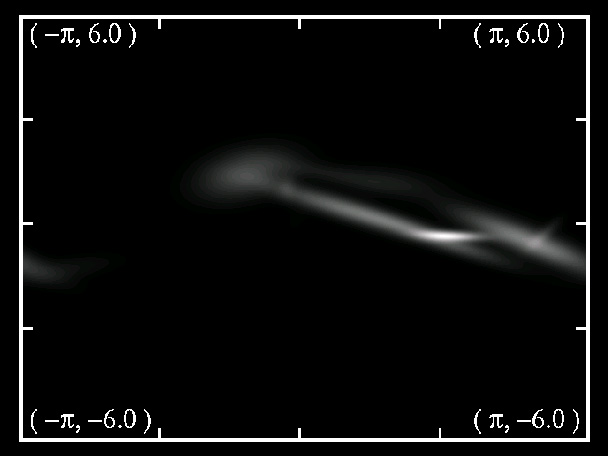
As can be seen from these plots, the object spends most of its time in only a small region of the state space. We must generate a new state from within this region. We can take these samples and run them through a standard-density estimation algorithm, (in this case, an EM algorithm). The result is shown for the same 2-D slice. Although this is only an approximation to the exact distribution, but it requires well under one percent of the original number of parameters.


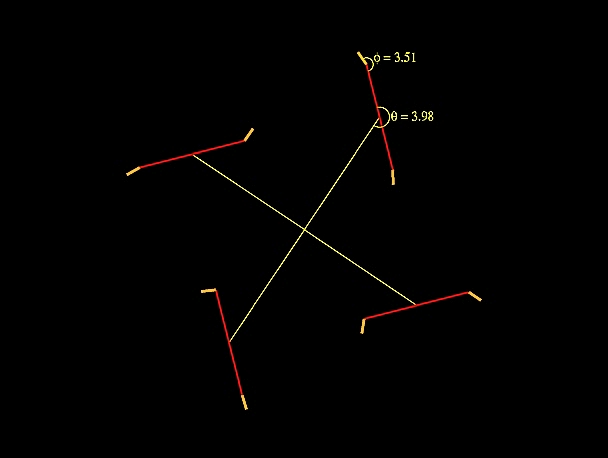
The complete dynamic system for the ride goes through a series of states as it starts up, runs, and slows to a stop (as represented by the diagram on the left). Each state has unique dynamics. As seen in the video clip, the dynamics for some states make it difficult for a viewer to detect inconsistencies in the dynamics. These are marked in the diagram with red lines. If the interval over which we must catch up falls across one of these lines, we are free to sample a new state.
Consider, for example, the situation depicted in the second diagram. If the object moves back into view at the white dot and it was last seen at the gold dot, we need only evolve to the period shown by the white line. We save all the work indicated by the dashed line. The longer the object is out of view, the more work we save.
Ongoing work includes the investigation of neural networks as a possible approximation scheme for these dynamics. For more information, see Jeff's homepage: http://www.cs.berkeley.edu/~jeffi
 octopus.mpeg (459KB)
This sequence will show a ride moving back into view. A sampling strategy has been used to generate its new state. Note the lack of visible inconsistencies in its qualitative behavior.
 bumpers.mpeg (657KB)
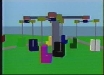
The bumper car simulation may also be modeled using similar techniques. Note that cars approximately move on ellipses around the track. We capture a six-dimensional distribution on the position and velocity of cars with respect to the largest ellipse.
For updating over a short time period, we sample a velocity and assume that the car has been moving with that velocity while out of view. This maintains qualitative properties such as distances between cars and the ordering of cars. For longer periods out of view, we sample the complete state of the cars.
 tilt.mpeg (558KB)
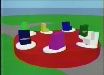
The tilt-a-whirl has similar dynamic properties to ride just demonstrated, and we use similar methods to approximate its behavior. In addition to a sampling strategy for the run state, we use a linear approximation to the differential equations when a car is in the decay state, as shown here. Thus, even though the user can predict state accurately we can still rapidly generate a new consistent state.
 general-walkthrough.mpeg (1440KB)
In this general walkthrough sequence, we show objects coming into and out of view. The dynamics for any object are not updated unless in view. For this sequence, the simulation attempts to maintain a constant frame rate. It will show lag if the dynamics cannot produce new state in time, but it will not speed up if the dynamics run faster. Note that there are no cases of very long lag times and only a few cases of noticeable frame rate degradation. We could produce arbitrary speed-ups in this world by making it larger and more complex, or by keeping the number of objects in any given view constant.
The video clips were recorded off a Pentium Pro 200 Mhz system with an Intergraph Intense 3-D graphics card.
Rendering was coded with OpenGL.
Equipment donated by Intel Corp.
Research funding provided by the
Office of Naval Research.
ONR-MURI N00014-96-1200
Copyright 1997 University of California at Berkeley
Back to the dynamics home page.
Web site problems: jimmyho@uclink.berkeley.edu