Associations between PET Amyloid Pathology and DTI Brain Connectivity in Preclinical Alzheimer’s Disease
[Accepted to Brain Connectivity, will be available soon]
Abstract. Characterizing Alzheimer’s disease (AD) at preclinical stages is crucial for
initiating early treatment strategies. It is widely accepted that amyloid accumulation is a primary
pathological event in AD. Also, loss of connectivity between brain regions is suspected of contributing
to cognitive decline, but studies which test these associations using either local (i.e., individual edges)
or global (i.e., modularity) connectivity measures may be limited. In the current study, we utilized
data acquired in 139 cognitively unimpaired participants. Sixteen gray matter regions known to be affected
by AD were selected for analysis. For each of the 16 regions, the effect of amyloid burden, measured using
Pittsburgh Compound B (PiB) PET, on each of the 1,761 brain network connections derived from diffusion tensor
imaging (DTI) connecting 162 gray matter regions was investigated. Applying our unique multi-resolution
statistical analysis called the Wavelet Connectivity Signature (WaCS), this study demonstrates the relationship
between amyloid burden and structural brain connectivity as assessed with DTI. Our statistical analysis
using WaCS shows that in 15 / 16 gray matter regions, statistically significant relationships between
amyloid burden in those regions and structural connectivity networks were observed. After applying multiple
testing correction, 10 unique structural brain connections were found to be significantly associated with
amyloid accumulation. For 7 of those 10 network connections, the decrease in their network connection
strength indexed by fractional anisotropy was in turn associated with lower cognitive function providing
evidence that AD-related structural connectivity loss is a correlate of cognitive decline.
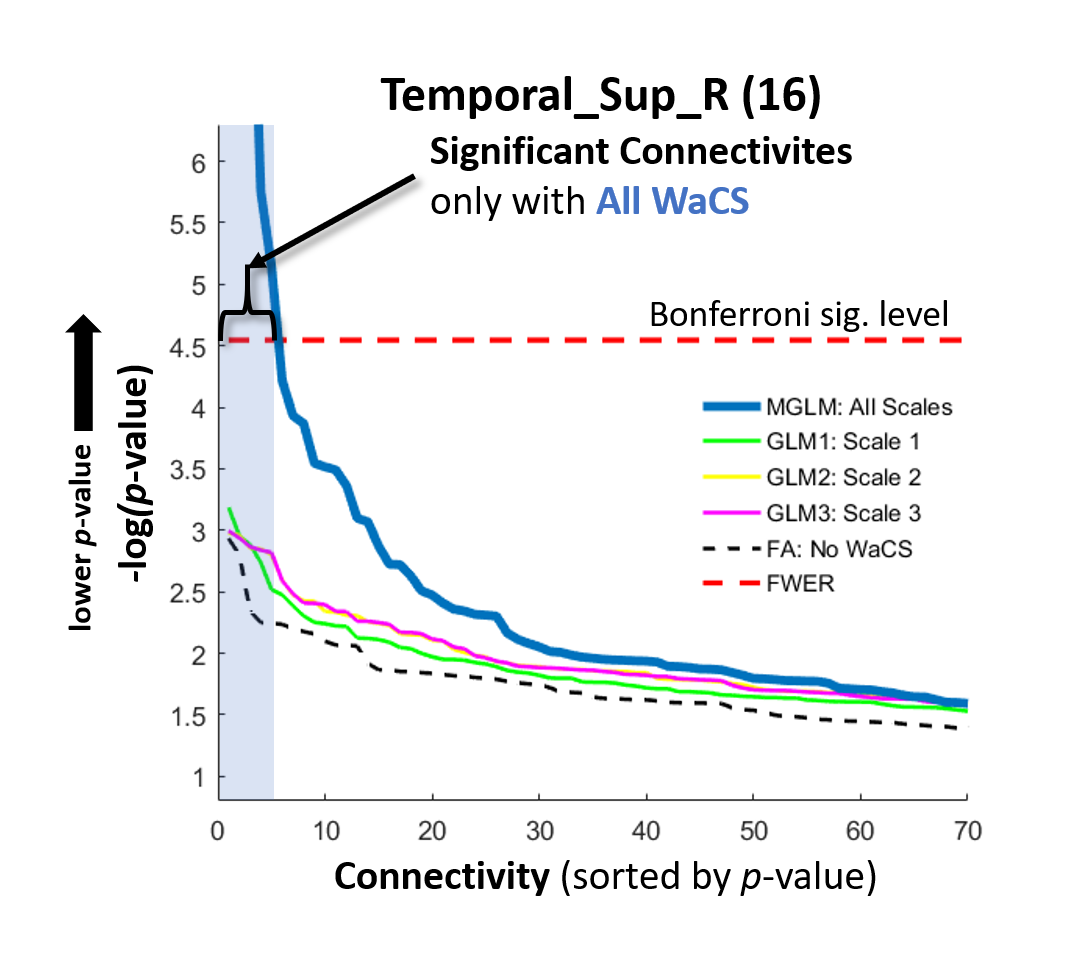 Figure 1: Comparisons of sorted p-values of one ROI (Temporal_Sup_R) using MGLM (blue) and GLMs (other straight lines) and FDR (red) in -log10 scale.
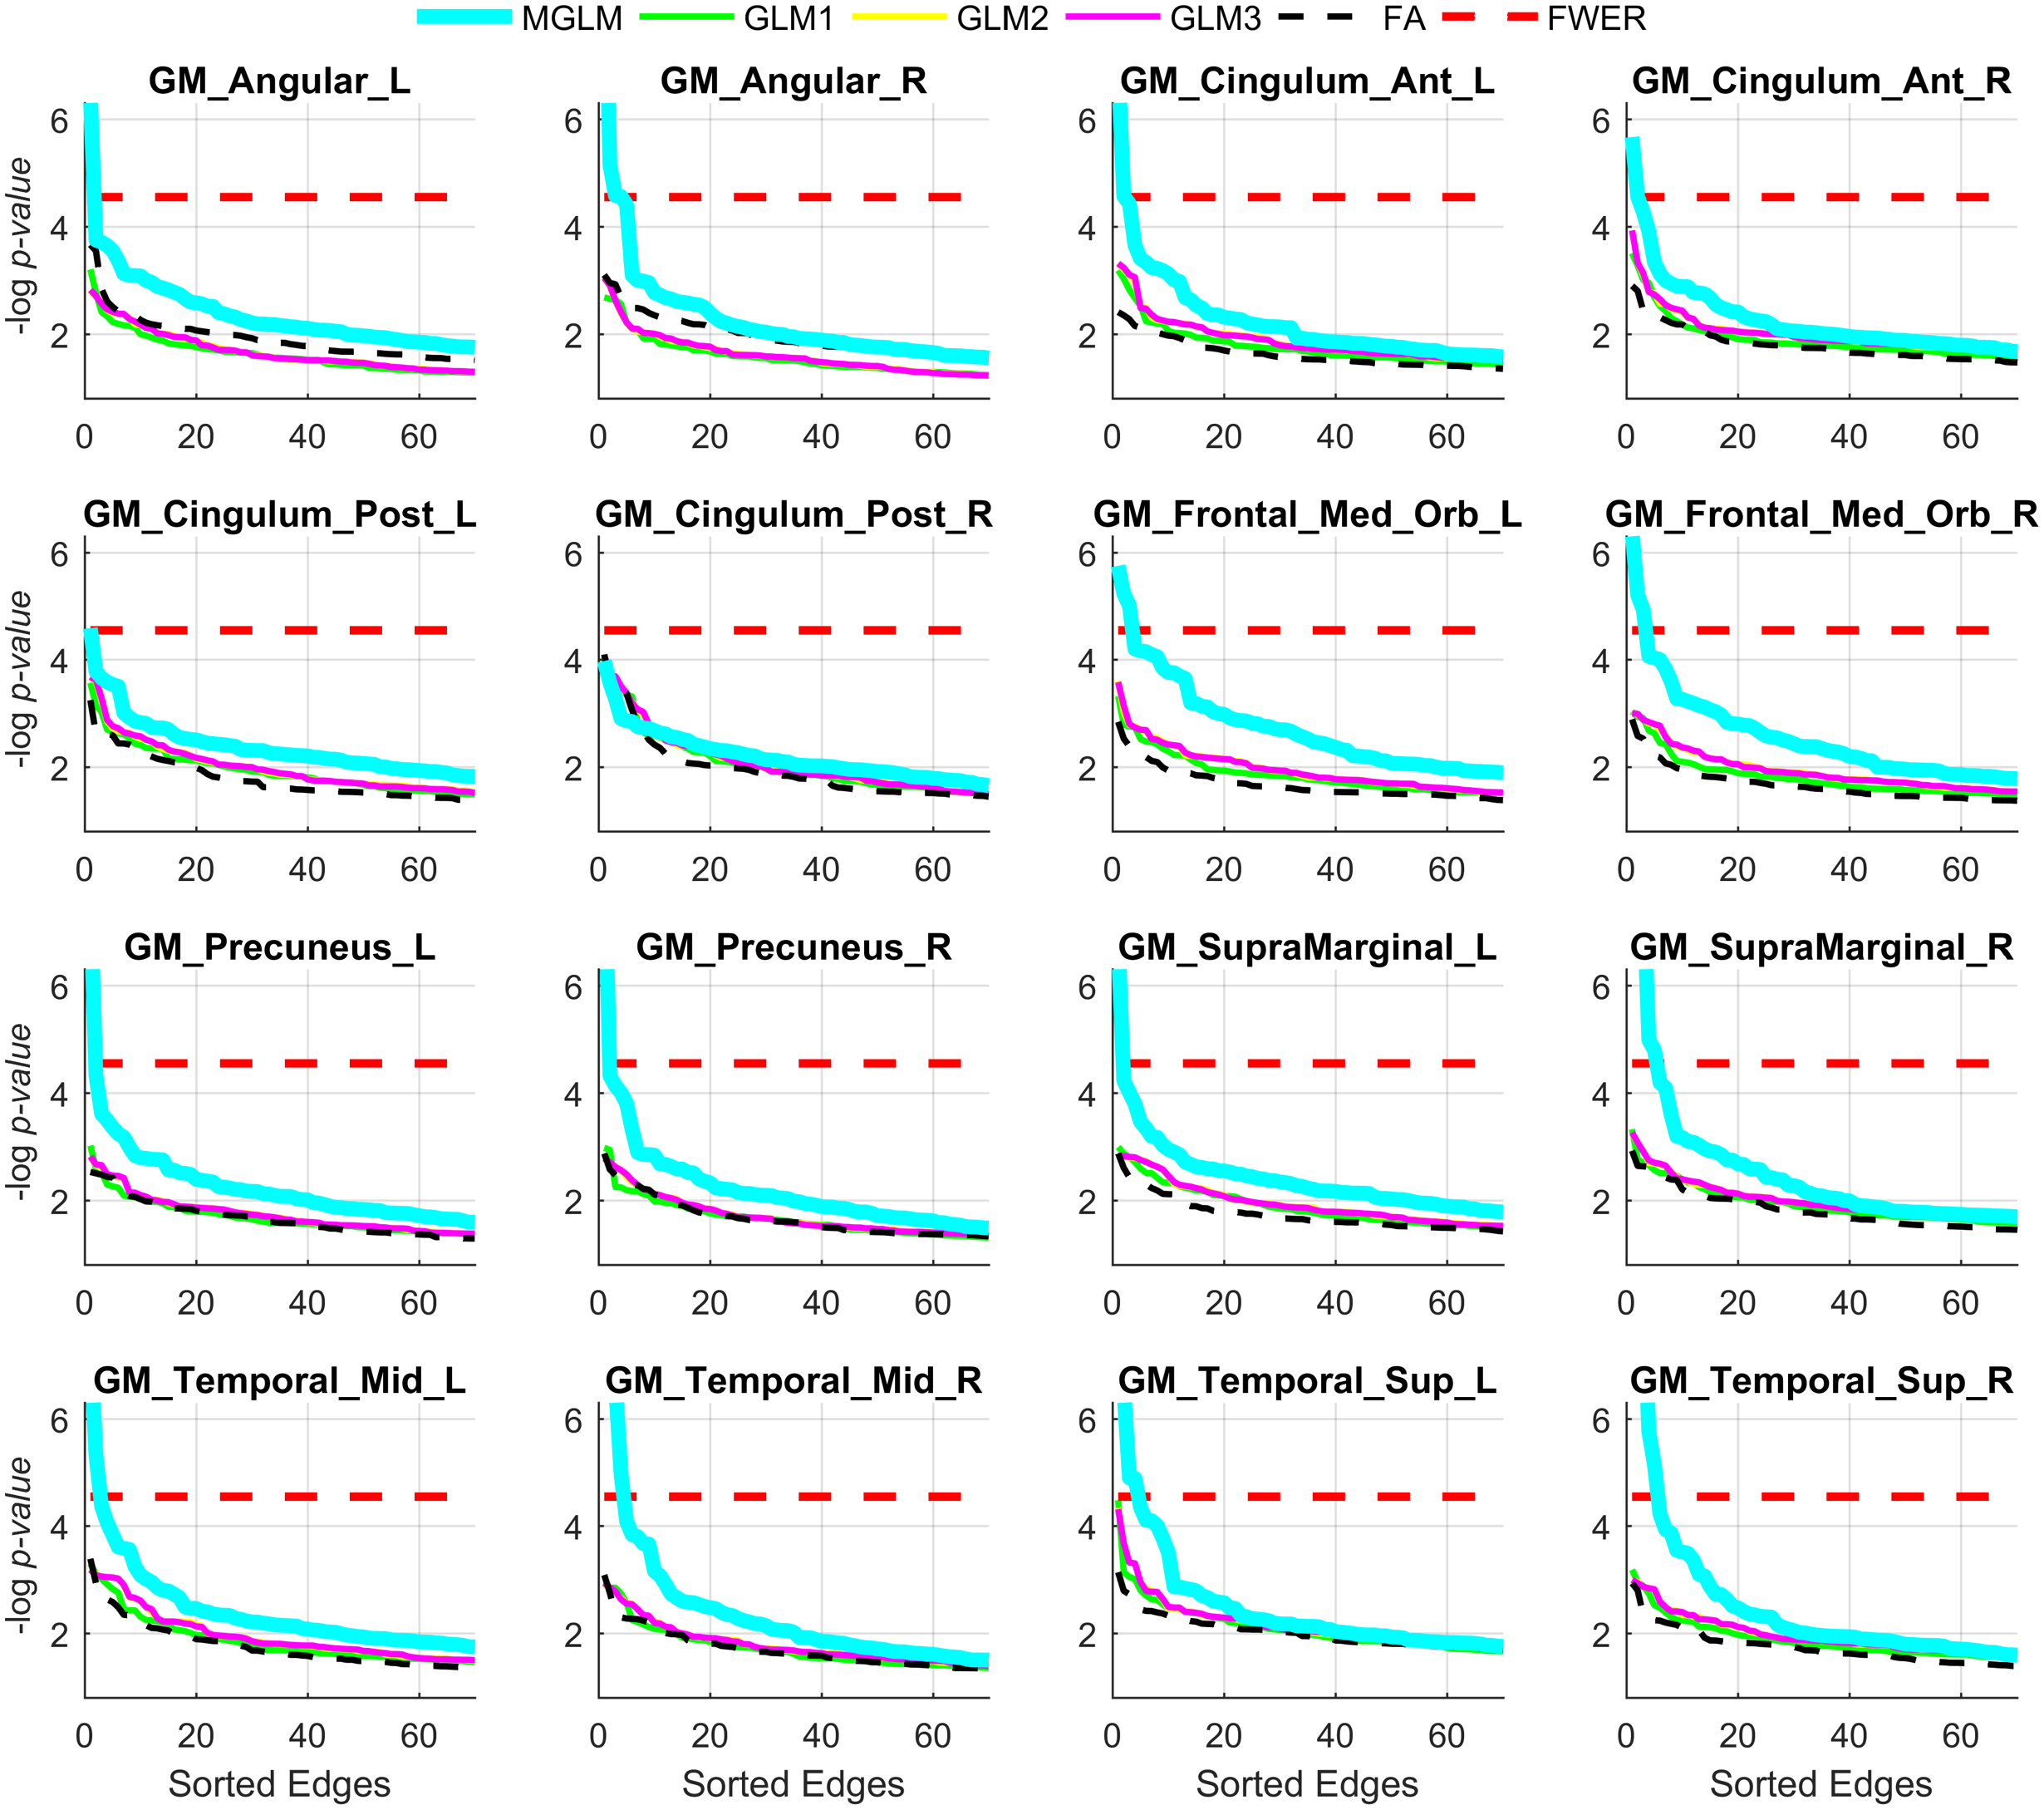 Figure 2: Comparisons of sorted p-values of 16 PiB ROIs using MGLM (cyan) and GLMs (other straight lines) and FDR (red) in -log10 scale.
Since the p-values are -log10 scaled and sorted, the edges with -log10 p-values above the red dotted lines (Bonferroni corrected significance level)
are significantly associated with the corresponding PiB ROI.
Figure 2: Comparisons of sorted p-values of 16 PiB ROIs using MGLM (cyan) and GLMs (other straight lines) and FDR (red) in -log10 scale.
Since the p-values are -log10 scaled and sorted, the edges with -log10 p-values above the red dotted lines (Bonferroni corrected significance level)
are significantly associated with the corresponding PiB ROI.
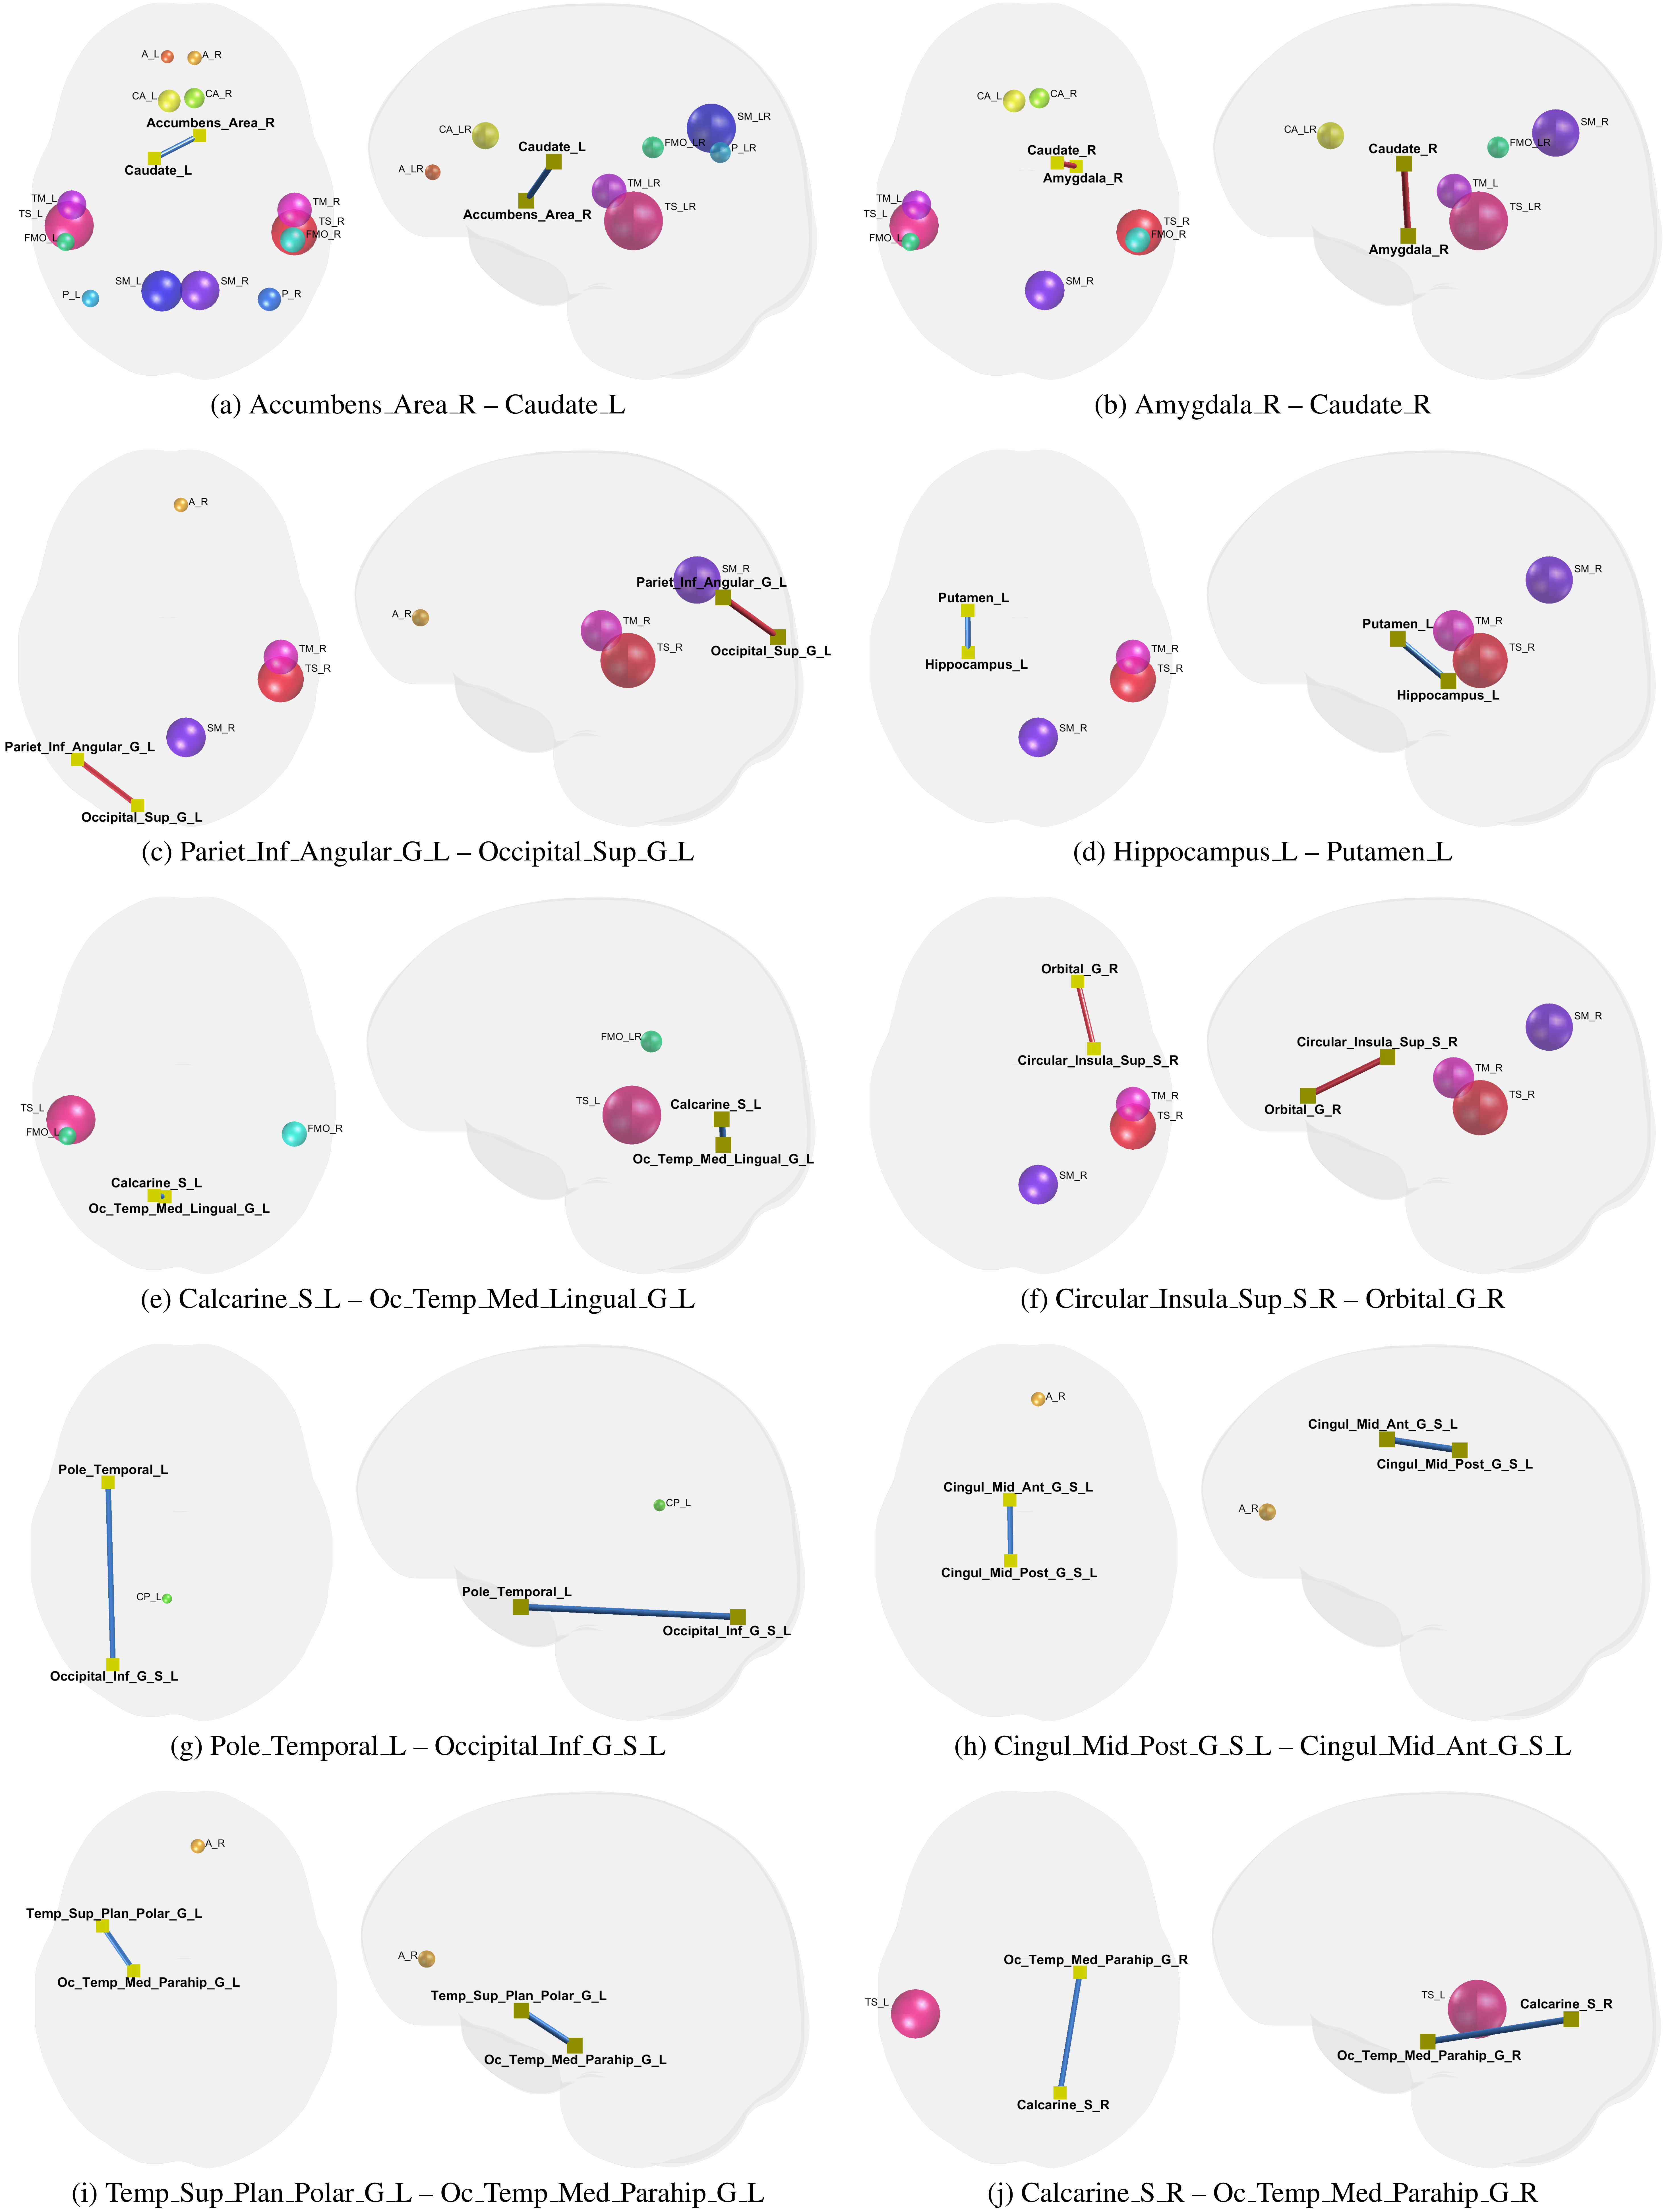 Figure 3: 10 unique connectivities (blue and red edges for positive and negative relations between the edge's FA vs. MMSE) found to have
statistically significant associations with at least one PiB ROI (sphere with sizes reflecting the volume).
Visit our presentation at AAIC 2016 in Session "O1-12 Development of New Models and Analysis Methods: New Insights from Imaging Approaches to Disease" on Sunday, July 24, 2016: 4:15 PM - 5:45 PM
References:
[1] Seong Jae Hwang, Won Hwa Kim, Barbara B. Bendlin, Nagesh Adluru, Vikas Singh,
"Multi-Resolution Analysis of DTI-Derived Brain Connectivity and the Influence of PET-Derived Alzheimer's Disease Pathology in a Preclinical Cohort",
Alzheimer's Association International Conference (AAIC), 2016.
[poster]
[2] Seong Jae Hwang, Nagesh Adluru, Won Hwa Kim, Sterling C. Johnson, Barbara B. Bendlin, Vikas Singh,
"Associations between PET Amyloid Pathology and DTI Brain Connectivity in Preclinical Alzheimer's Disease",
Brain Connectivity, 2018.
Acknowledgment:
SJH was supported by a University of Wisconsin CIBM fellowship (5T15LM007359-14). We acknowledge support from NIH grants AG040396 (VS), NIH R01 AG37639 (BBB), NSF CCF 1320755 (VS), NSF CAREER award 1252725 (VS), UW ADRC AG033514, UW ICTR 1UL1RR025011, Waisman Core grant P30 HD003352-45 and UW CPCP AI117924.
Figure 3: 10 unique connectivities (blue and red edges for positive and negative relations between the edge's FA vs. MMSE) found to have
statistically significant associations with at least one PiB ROI (sphere with sizes reflecting the volume).
Visit our presentation at AAIC 2016 in Session "O1-12 Development of New Models and Analysis Methods: New Insights from Imaging Approaches to Disease" on Sunday, July 24, 2016: 4:15 PM - 5:45 PM
References:
[1] Seong Jae Hwang, Won Hwa Kim, Barbara B. Bendlin, Nagesh Adluru, Vikas Singh,
"Multi-Resolution Analysis of DTI-Derived Brain Connectivity and the Influence of PET-Derived Alzheimer's Disease Pathology in a Preclinical Cohort",
Alzheimer's Association International Conference (AAIC), 2016.
[poster]
[2] Seong Jae Hwang, Nagesh Adluru, Won Hwa Kim, Sterling C. Johnson, Barbara B. Bendlin, Vikas Singh,
"Associations between PET Amyloid Pathology and DTI Brain Connectivity in Preclinical Alzheimer's Disease",
Brain Connectivity, 2018.
Acknowledgment:
SJH was supported by a University of Wisconsin CIBM fellowship (5T15LM007359-14). We acknowledge support from NIH grants AG040396 (VS), NIH R01 AG37639 (BBB), NSF CCF 1320755 (VS), NSF CAREER award 1252725 (VS), UW ADRC AG033514, UW ICTR 1UL1RR025011, Waisman Core grant P30 HD003352-45 and UW CPCP AI117924.