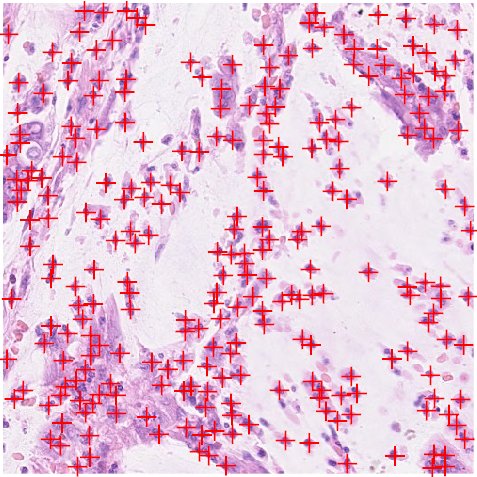
"Golden" data provided: (x,y) pairs for each human-labeled nucleus
Motivation | Methodology | Implementation Details
Results | Files | References
Diagnosis and staging of many types of cancer rely in part on evaluation of nuclear characteristcs such as size and shape. As such, automated techniques for segmenting nuclei are key for cancer image analysis pipelines. The current gold standard for diagnosis and staging is manual evaluation of slides by eyeballing these nuclear characteristics, leading to issues of poor reproducibility.
Multiple techniques for automated nuclei segmentation exist [3-5] and are becoming more common in the research and clinical setting. We aimed to implement one of these techniques and to evaluate it on a data set of certain tissue type that it has not been evaluated against in the literature (to our knowledge).
In this project, we aimed to implement a marker-controlled watershed segmentation algorithm [1] and evaluate it on a set of colon cancer images which have already had their nuclei labeled. Ultimately, this is a marker-controlled watershed approach [11] that uses fast radial symmetry transformation (FRST) [2] to generate the markers. (These steps are explained in Implementation Details.) We implemented the segmentation algorithm in MATLAB.
To evaluate this implementation, we identified a data set published by the Tissue Image Analytics Lab at the University of Warwick (see Files for a link). This data set contains 100 cases, each of which contains a 500x500px whole-slide tissue image as well as a set of human-labeled nuclei centroids (x, y coordinate of each centroid). We set up an evaluation pipeline that involved taking the whole-slide image and running it through segmentation, producing a labeled image of nuclei. We then compared our results against this labeled images to measure the overall recall and precision of the segmentation.
"Golden" data provided: (x,y) pairs for each human-labeled nucleus |
We implemented the algorithm described in [1] as accurately as we reasonably could based on the text. This involved six approximately independent steps to accomplish:
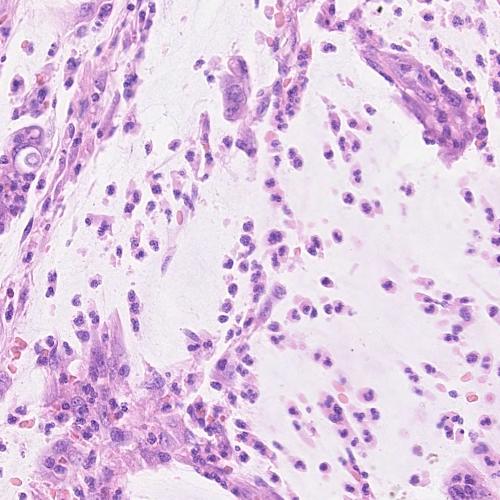
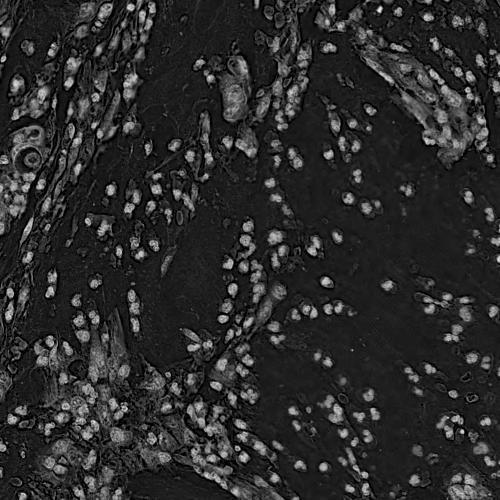
The goal of this step is to remove irrelevant structures while maintaining the overall nuclear morphology. Since the tissues are stained using hematoxylin and eosin (H&E) [9], we used color deconvolution [8] to separate only the hematoxylin channel, which stains the nuclei. We used CellProfiler [10] to perform color deconvolution. We then used morphological opening and closing by reconstruction (imerode/imdilate/imreconstruct in MATLAB) to smooth the nuclear structures.
Original image | After color deconvolution |
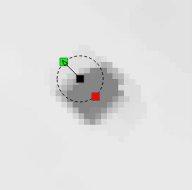
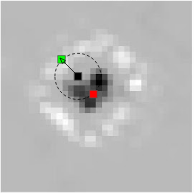
To generate the markers used in watershed, we applied fast radial symmetry transformation to the pre-processed image. This transformation was first described by Loy and Zelinsky [2]; we implemented it based on their paper. The transformation essentially highlights the center of groups of pixels which have high radial symmetry. The transformation is tuned based on a few parameters: the expected radius/radii of objects to identify, and a radial strictness parameter which indicates how much radial symmetry an object must have to be emphasized by the transformation.
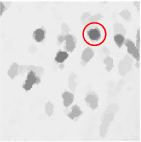
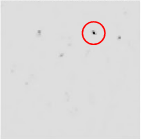
Single Nucleus: Pre-processed Image | Single nucleus: FRST result |
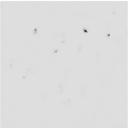
Multiple Nuclei: Pre-processed Image | Multiple Nuclei: FRST result |
As you can see from the example result, FRST generates an image that contains some regional minima which are highly suspected to be centers of the nuclei we want to segment.
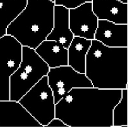
We must now take the FRST result and identify an exact set of markers which we think correspond to nuclei centers (ideally one marker per). To do this, we used MATLAB’s extended-minima transform. This is used to filter out regional minima on the FRST result which are not different enough from their surroundings, and thus did not exhibit enough radial symmetry. The remaining markers are the foreground markers.
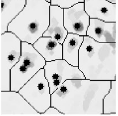
These foreground markers will be used during watershed as seed points for the flooding, in order to improve accuracy of watershed. To generate background markers, we first generated a temporary image. On this temporary image, we took each foreground marker and on each we imposed a disk that has radius corresponding to the expected radius of our nuclei. We then took this image of disks and computed the morphological skeleton (using bwmorph) to produce the background markers.
FRST result | Markers | Markers Imposed on Preprocessed Image |
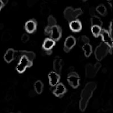
After generating the foreground and background markers, we are ready to generate the input that we will give to watershed. This input to watershed is referred to as the segmentation function; it is essentially an image whose dark regions (relative to the surroundings) are the regions we want to segment. In other words, the borders of objects to be segmented should have higher pixel values than the inside of the object.
In our case, the Sobel gradient magnitude is ideal as the segmentation function. We took the gradient magnitude of the pre-processed image and we imposed the previously identified markers as regional minima on that gradient magnitude image. This composite was used as the segmentation function for watershed.
Markers on Pre-processed Image | Segmentation Function |
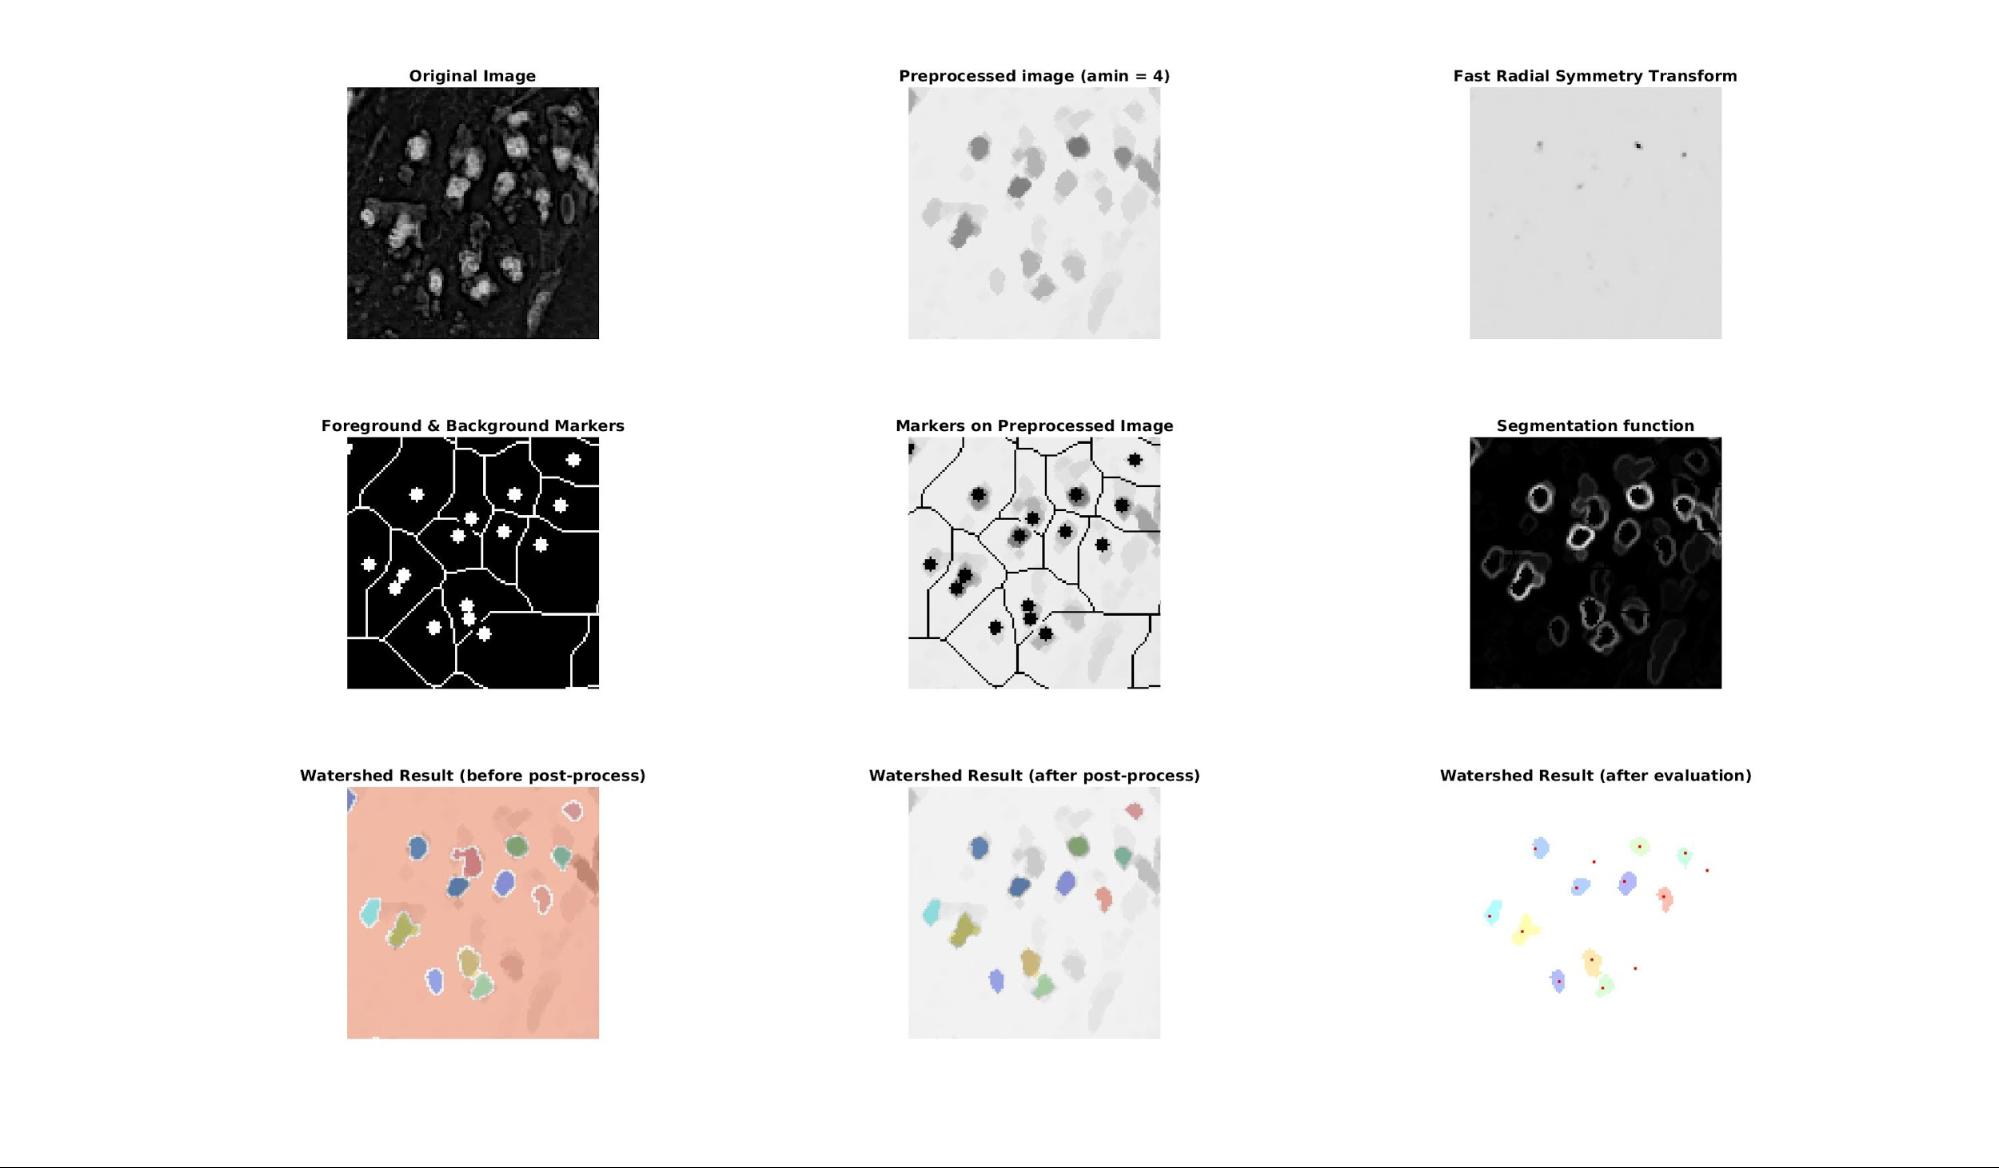
The watershed algorithm [6] treats the segmentation function as if it is topology, "flooding" from regional minima. We used the built-in MATLAB watershed function.
Watershed animation (source) |
Since we have imposed regional minima at exactly the FRST markers, we will end up with one object segmented per FRST marker.
Since there may not be a 1:1 relationship between FRST markers and nuclei, we remove regions which are unlikely to represent actual nuclei:
In order to evaluate the performance of the algorithm, we ran it on the dataset described in Methodology. We used the notions of precision and recall to measure performance. On average, we achieved 80.3% recall across all 100 slides. This compares favorably to the 81% recall reported in [2]. Depending on the parameters used, there is a tradeoff between precision and recall. Our precision numbers were low, which can at least partially be explained by the labeled data not including all nuclei (hence potentially decreasing the numerator in the precision expression).
We found that tuning the parameters for individual slides yielded 70-80% precision and recall, however we were not able to find a single set of parameters which performed with high precision and recal for all slides. Future work could include generalizing the parameter selection process to tune for optimizing precision and recall.
[1] Veta, M., Huisman, A., Viergever, M. A., Diest, van, P. J., & Pluim, J. P. W. (2011). Marker-controlled watershed segmentation of nuclei in H&E stained breast cancer biopsy images. In Proceedings of the 8th IEEE International Symposium on Biomedical Imaging : From Nano to Macro ( ISBI'11), 30 March 2011 through 2 April 2011, Chicago, IL. (pp. 618-621). Piscataway: Institute of Electrical and Electronics Engineers Inc.. DOI: 10.1109/ISBI.2011.5872483
[2] Loy G, Zelinsky A (2003) Fast radial symmetry for detecting points of interest. IEEE Trans Pattern Anal Machine Intell 25: 959-973.
[3] Irshad H, Veillard A, Roux L, Racoceanu D. Methods for nuclei detection, segmentation, and classification in digital histopathology: a review-current status and future potential. IEEE Rev Biomed Eng. 2014;7:97-114.
[4] Korsuk Sirinukunwattana, Shan E Ahmed Raza, Yee-Wah Tsang, David R. J. Snead, Ian A. Cree, Nasir M. Rajpoot, "Locality Sensitive Deep Learning for Detection and Classification of Nuclei in Routine Colon Cancer Histology Images", Medical Imaging IEEE Transactions on, vol. 35, pp. 1196-1206, 2016, ISSN 0278-0062.
[5] Bamford P, Lovell B (1998) Unsupervised cell nucleus segmentation with active contours. Signal Process 71: 203-213.
[6] Digabel, H., and Christian Lantuéjoul. "Iterative algorithms." Proc. 2nd European Symp. Quantitative Analysis of Microstructures in Material Science, Biology and Medicine. Vol. 19. No. 7. Stuttgart, West Germany: Riederer Verlag, 1978.
[7] Veta M, van Diest PJ, Kornegoor R, Huisman A, Viergever MA, et al. (2013) Automatic Nuclei Segmentation in H&E Stained Breast Cancer Histopathology Images. PLoS ONE 8(7): e70221. doi:10.1371/journal.pone.0070221
[8] Ruifrok, Arnout C., and Dennis A. Johnston. "Quantification of histochemical staining by color deconvolution." Analytical and quantitative cytology and histology 23.4 (2001): 291-299.
[9] Fischer, Andrew H., et al. "Hematoxylin and eosin staining of tissue and cell sections." Cold Spring Harbor Protocols 2008.5 (2008): pdb-prot4986.
[10] Carpenter, Anne E., et al. "CellProfiler: image analysis software for identifying and quantifying cell phenotypes." Genome biology 7.10 (2006): R100.
[11] Parvati, K., Prakasa Rao, and M. Mariya Das. "Image segmentation using gray-scale morphology and marker-controlled watershed transformation." Discrete Dynamics in Nature and Society 2008 (2009).
[1] The project description since proposal has changed slightly.
[2] The project description since midterm report has changed slightly.