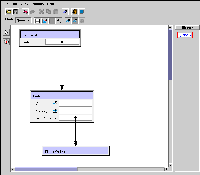
Figure 9: Example query with plot visualization (click on image for larger version)
This visualization method presents the results of a query in a plot. This method, therefore, can only support two projections, one for the x-axis and one for the y-axis of the plot. Currently, Squid supports plots of numerical attributes (integers and reals) only. The method is activated by clicking on the Plot Visualization Tool . In order to designate the x-projection (y-projection) of the plot, the user activates the X-Axis Projection Tool ( Y-Axis Projection Tool ) and clicks on the appropriate field. When the query is executed, the user is presented with a separate window containing the plot.

Figure 9 shows an example query that uses the plot visualization: the Field.nChild is projected on the x-axis of the plot, while the Field.nGalaxy field is projected on the y-axis. The semantics of the query can be described as follows: For each Field object, retrieve the nChild and nGalaxy fields and draw the corresponding point on the plot.

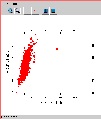
Figure 10 shows the generated plot when the query is executed. Note that the plot appears immediately, before the query completes, and is updated continuously as new results are fetched. The plot window offers the following functionality:
Re-execute the query that produced the plot and update the view with the new results.
Select the query that generated these results. The query is selected in the history window and shown in the canvas.
Draw a scatter plot of the values.
Draw a plot using lines to connect the points.
Freeze the visualization in its current state. The corresponding query is paused and no new results are fetched from the database. By pressing the button again, the user causes the query to resume execution and the visualization is updated with the new results.
Stop the execution of the query. This cancels the query on the database server and the visualization is not be updated with any new results thereof. From this state, the user can only restart the visualization from the beginning with the refresh button.