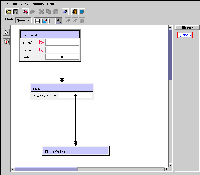
Figure 13: Example query with statistics visualization
The statistics visualization method retrieves a number of useful statistics for selected fields. The user activates this method with the Statistics Tool and then clicks on the appropriate fields to include their statistics in the visualization. When the query is executed, a separate window is presented that includes the average, standard deviation, min, max and count of the values of the selected fields.

Figure 13 shows an example query with statistics annotations on the Segment.camCol and Segment.rerun fields. Figure 14 shows the resulting window for the example query.

The statistics window offers the following functionality:
Re-execute the query that produced the statistics and update the view with the new results.
Select the query that generated these results. The query is selected in the history window and shown in the canvas.