 |
Block diagrams are a handy and efficient way to quickly convey information about how a bunch of things work together. This semester in p-chem class almost all the labs come with block diagrams of the apparatus, which we're supposed to memorize. This week, and this week only, see some block diagrams that I either copied from somewhere, or invented myself.
| Date | |
|---|---|
| Sunday October 17, 1999 |
Experiment 87
This one is straight out of our lab handout. It's a block diagram of the nitrogen discharge lab. What you do is put nitrogen gas in a discharge tube, put a high voltage across it until it glows, then look at the emission spectrum with a monochrometer. |
| Monday October 18, 1999 |
Lecture
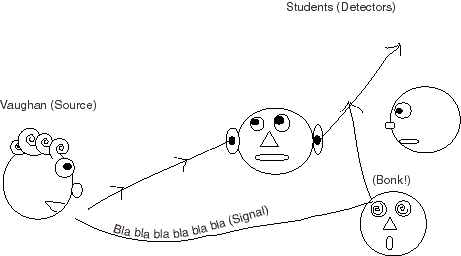
Twice during the semester we get lectured to by Professor Vaughan. Here is a block diagram summarizing how that works. |
| Tuesday October 19, 1999 |
A race car
I asked my mechanical engineer roommate, Kevin, how a race car works and this is kind-of related to what he told me. I guess in real life most cars don't have a whole team of horses. |
| Wednesday October 20, 1999 |
A grating monochrometer
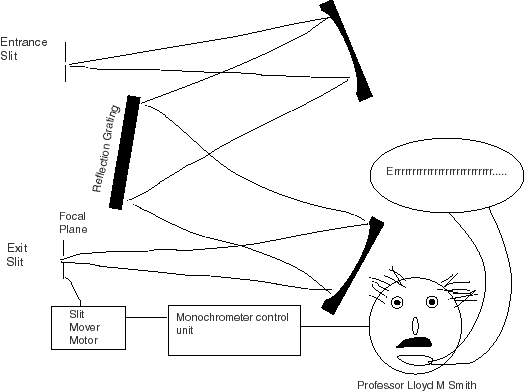
A monochrometer is useful device in spectroscopy. One shines in a beam of radiation in, and it separates the different wavelengths using a diffraction grating or something. Then you can look at the intensities for a small range of wavelengths by moving the exit slit. Monochrometers make a sort of buzz-humm sound as they run. Professor Lloyd Smith does such an errily good impression of this sound I decided that it must actually be him in the box. The monochrometer control unit tells him when to make noise. |
| Friday October 22, 1999 |
Network diagramsThere are some block diagrams of the network of the place where I used to work online. Both of these were originally done by Patricia Kovatch and then messed with by me. You can see the new ATM network and the not so new FDDI network. |