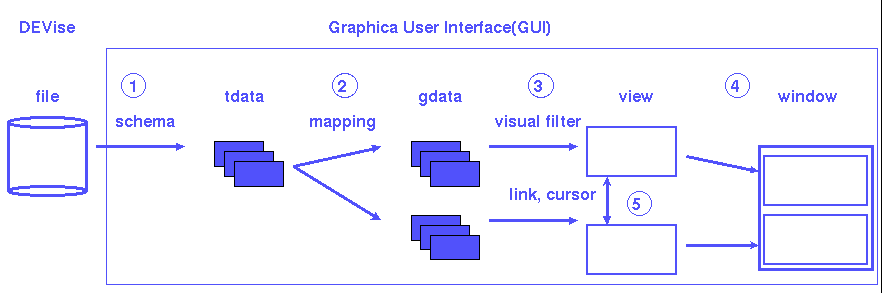
GData
 The model of visualization is used to design the framework from which
DEVise is constructed. It is also the best way to understand how
DEVise functions.
The model of visualization is used to design the framework from which
DEVise is constructed. It is also the best way to understand how
DEVise functions.
The stages of creating a visualization are as follows:
The first line names the file type: Sensor. All sensor files have
data stored in the same format. More than one file type can be
imported into DEVise, each having its own schema file. For example, we
can also create a Stock file type to read information about stock
prices, with data stored in a different format. The second line tells
DEVise to ignore lines that start with '#'. The third line tells
DEVise that the attributes in the file are separated by white
spaces. DEVise can also read files separated by other delimiters,
such as '10,20,20'. The remaining lines describe attribute names,
types, and ranges.
TData
A Textual Data (TData) is the representation used by DEVise to access
files (or other types of input data). Once a file is imported into
DEVise as a tdata, the user uses the tdata to create visualizations.
Different types of input files are input into DEVise and treated
uniformly as TData.
After selecting the file type, the user is asked to enter an alias
for the tdata. The default name is the name of the input file,
stripped of its path information. After entering the alias, the file
is imported as TData into DEVise.
Mapping
A mapping converts TData attributes into graphical data (GData)
attributes. The user decides how tdata is visualize by selecting the
tdata attributes that map onto the the x, y, color and shape gdata
attributes. Notice that a TData can be visualized in more than one way
by creating more than one mapping.
For our example, we can create the following example mappings:
sin_vs_time:
x <-- time
y <-- sin
cos_vs_time:
x <-- time
y <-- cos
sin_vs_cos
x <-- cos
y <-- sin
Once a mapping is created, it can be used on all TData with the
same file type.
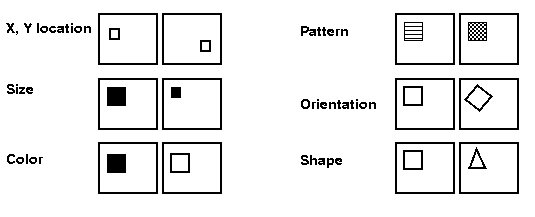
GData
The graphical data (gdata) is the graphical representation of the
tdata. It consists of attributes: x, y, color, pattern, size,
orientation, shape, and shape specific attributes.
Visual Filter
A visual filter defines a query over the graphical data attributes of
the gdata. Our implementation supports range query over the X and Y
GData attributes. Use visual filter to specify portions of GData to
be viewed.
View
A view is used to display those gdata that fall within the range of
the visual filter. Currently we have two types of views: Scatter and
SortedX. The Scatter view is used to draw a scattered plot. The
SortedX view implements optimizations used to reduce the time used to
draw the gdata if the X attribute is sorted.
Window
A window provides the screen real estate used by views to draw the
gdata. It it also responsible for arranging views in its
boundaries. Currently, DEVise supports tiled/automatic, vertical, and
horizontal window layouts.
A view can be removed from a window to reduce clutter, or be moved to another window so that related views are brought together for comparison.
Windows can be duplicated, a very handy feature.
Link
A link is used to link visual filters so that updating one
synchronously updates all linked visual filters. We have implemented
links for linked axes, either linked x and/or y axes. However, a link
in theory can be used on any of the of the graphical attributes: x, y,
color, size, pattern, orientation, and shape.
Cursor
A cursor can also be used to display the X/Y boundaries of one view
within another view. A cursor contains both a source view and a
destination view. The source view is where the cursor fetches
information about the current view X/Y axes boundaries. The boundaries
of the source view are drawn as line segments in the axes of the
destination view. Click in the axes area of the destination view to
move the source view (by changing its visual filter) to the location
clicked.
Back to DEVise home page.