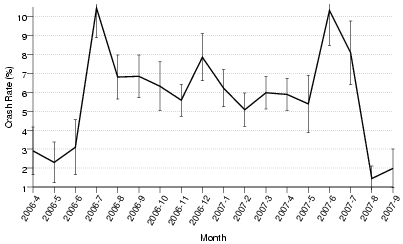
The chart on the right plots the observed crash rate of Nautilus over the period April 2006 – September 2007. The skinny bars indicate the 95% range for each month - we can say with 95% certainty that the actual crash rate is in that range. Notice the unusually high crash rates for July 2006 and June 2007. We know that these are not flukes since the low ends of their ranges are still higher than the high ends of nearby months. We can therefore state that July 2006 had a significantly higher crash rate than June and August 2006, and that June 2007 had a significantly higher crash rate than May and August 2007.
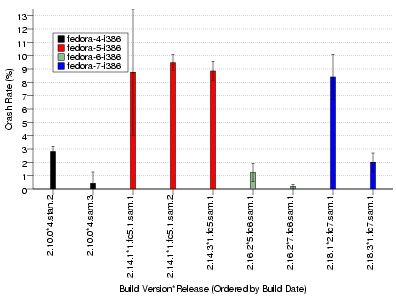
The chart on the left plots the observed crash rate of Nautilus based on build distribution. Notice that the builds for Fedora-5 have relatively high crash rates. These builds would account for the unusually high crash rate for July 2006, and the release of the relatively crash-free Fedora-6 builds would account for the subsequent lower crash rates in later months. The fact that crash rates for August 2006 – May 2007 hover around 5% while rates for the Fedora-6 builds are below 2% indicates that Nautilus for Fedora-5 still saw heavy usage at least until the release of Nautilus for Fedora-7 in June.
The highly unstable (~8% crash rate) nature of the first build for Fedora-7 comes as no surprise after seeing the spike in the above graph around the time that build was released. The subsequent sheer drop in the Nautilus crash rate in August then indicates that users rapidly adopted the second, more stable (~2% crash rate) Fedora-7 Nautilus build.
All data on this page comes from the user community. Joining is easy! Simply download and install these special bug-hunting packages.