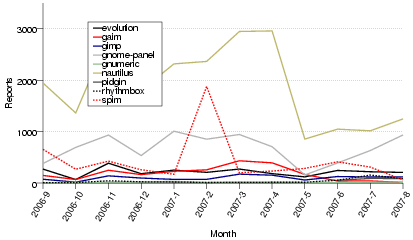
This plot shows the number of reports received each month for each application, excluding the current month.
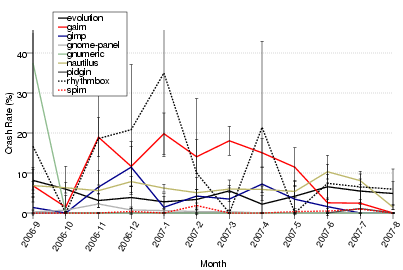
This plot shows the crash rate of each application by month, excluding the current month. The crash rates shown are estimates based on the reports we receive. The skinny bars indicate the certainty of our estimates. Statistically, for each estimate, we are 95% certain that the actual crash rate is within the range of the bar. In general, two crash rates are significantly different (in a stastistical sense) if their bars do not overlap.
All data on this page comes from the user community. Joining is easy! Simply download and install these special bug-hunting packages.