
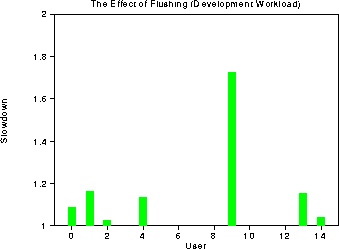
We expect the cache sensitivity of a particular user's workload to be directly related to the amount of time spent doing IO. As described above, we re-ran the development workload, this time clearing the cache state in between each program execution. The resulting time, minus the time to execute to cache clean, allows us to calculate the worst-case slowdown for each of the user's slowdown. The following graph shows the results of this experiment. User 2's workload only spent 10% of its time doing IO; correspondingly, only a 5% slowdown was felt from losing cache state in between runs. On the other hand, user 9's workload spent 50% of its time doing IO, and thus suffered a slowdown of nearly 75%.
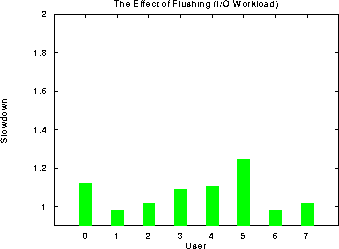
The next graph demonstrates the correspondence between a
workload's IO time and slowdown is not quite as strong as the one
demonstrated by the development workload with slowdowns varying from
negligible to approximately 25%. One explanation for this might be
that some of the programs in the IO workload do not demonstrate strong
locality in their file accesses or that they stream through a large
amount of data. Thus, by the end of their run data accessed at the
beginning of execution may have already been flushed from the cache,
leaving the file cache less useful for future runs. Such behavior in
the IO workload would be in direct contrast to the development
workload which must constantly read in relatively small, fairly static
source files.
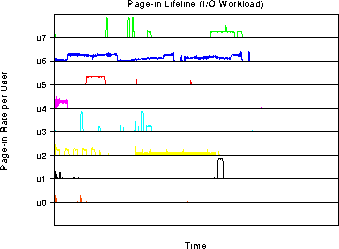
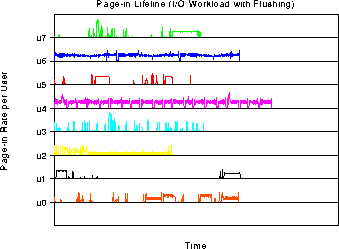
The next two graphs simply demonstrates the IO workload's paging
behavior over time. We used the UNIX utility program vmstat to record
the number of page faults every two seconds as the workloads executed.
The graphs show that some of the workloads indeed do not exhibit
strong locality in their file access behavior, accruing page faults
throughout their entire runtime. u6 and u2 demonstrate this behavior
for exaxmple, and suffer a negligible slowdown when the cache is
cleared between program runs. Other users (u0, u3, u4, u5) do
demonstrate strong file access locality and make good use of their
file cache. When the file cache is cleared between individual runs,
these users incur many more page faults and suffer slowdowns between
15 and 25 percent.
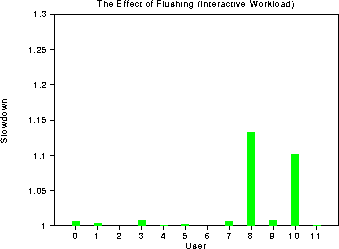
The following graph demonstrates most interactive users are unlikely
to be sensitive to cache state. Of the 12 users, 10 suffered
negligible slowdown when the cache state was cleared between runs.
The users which did suffer a 10 to 15% slowdown, u8 and u10, were
running ghostscript, an X postscript previewer and, ps2gif, a program
which converts postscript files to gif format (both workloads spend a
relatively large amount of time reading files accounting for their
cache sensitivity). Of course, these overall numbers do not reflect
the impact upon interactive response time. If a user has to wait a
few seconds for his X or emacs state to be reloaded when the keyboard
is touched, it is unlikely to significantly impact overall slowdown,
however it is likely to frustrate users and increase response time.
IO Workload
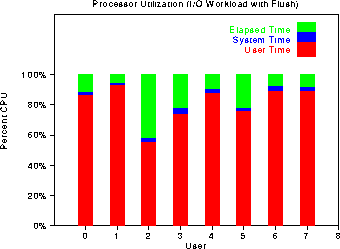
The following graph breaks down the user, kernel, and IO times for the
IO workload. Unfortunately, if the definition of an IO workload
requires at least 50% of a workload's time to be spent doing IO, this
workload fails by that metric. The IO time varies from 5% for u1 to
40% for u2.
Interactive Workload
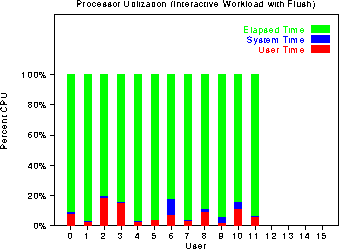
The next graph breaks down the user, kernel, and idle times for each of
the 12 users in the interactive workload. In this case, the green
bars do not represent IO time, but rather actual idle time since the
different scripts simulate users typing at the keyboard at fairly slow
rates. In fact, very little IO is done for any of the users.

 Back to Top-Level