Better Machine Learning
Shrey Shah · December 2021
There is a significant lack of understanding of what drives the success of modern machine learning techniques.
It is a widely adopted practice to train ResNet-50 for 90 epochs. This is not due to some rigorous reasoning, but rather the precedent set by the arbitrary decision of the original ResNet paper authors. More recent self-supervised learning papers extend this training time to hundreds of epochs—it’s hard to achieve good results at 90 epochs, so these papers continue training until they get better numbers.
Even widely used techniques, such as residual connections, learning rate schedules, and batch normalization, are not well understood. I’ve read many machine learning papers that try to explain why batch normalization works and each seems to have a different explanation. This type of inconsistency seems pervasive in the field.
In trying to replicate results, I frequently find that the optimization of baselines is neglected (somewhat understandably, given the focus tends to be on the proposed work). However to achieve meaningful results, these baselines should be optimized with the same level of diligence as the proposed work. This means the baselines and also must be run on identical hardware. A surprising number of papers deploy their proposed framework on better hardware compared to the baseline and subsequently attribute the resulting speedup to their own methodology rather than the hardware.
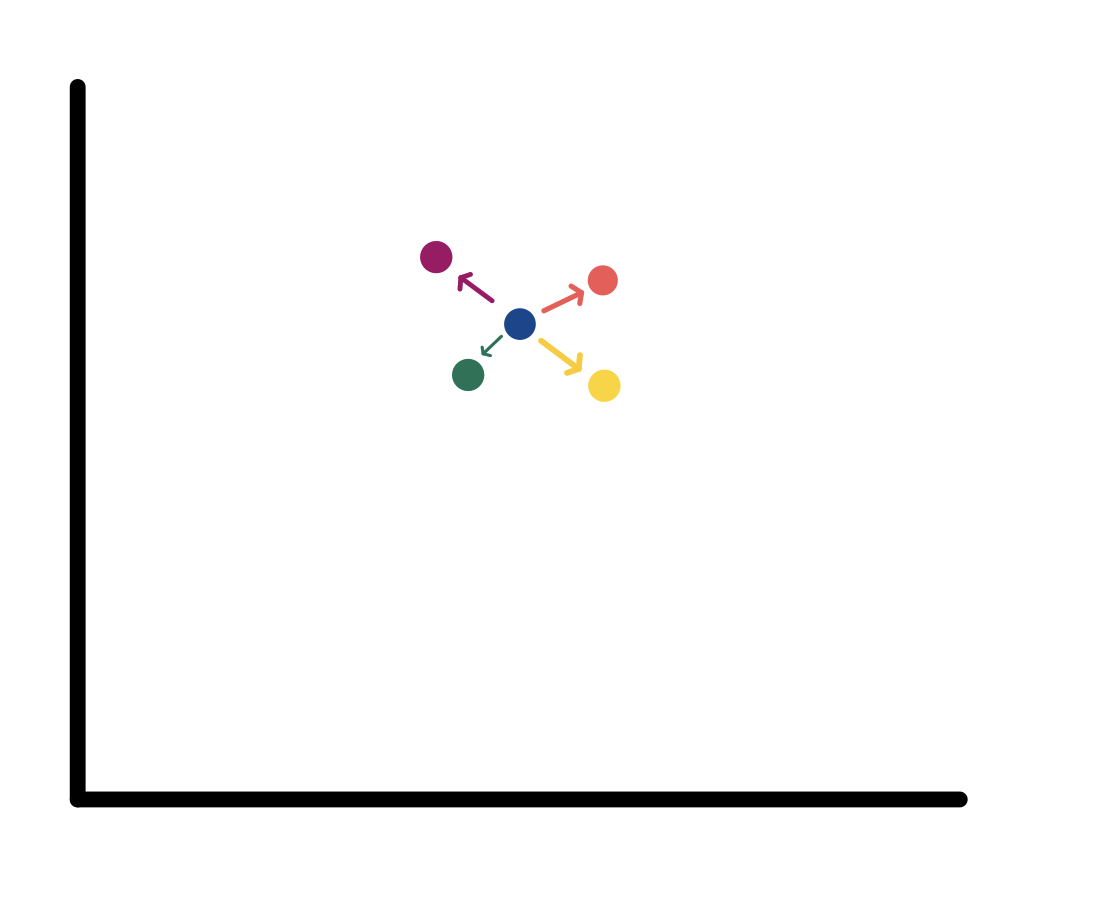
The choice of evaluation metric is also crucial. Model improvements should be reported in meaningful metrics—either an increase in model quality, a decrease in cost, or a decrease in wall clock time. There are a lot of ways to make other metrics (ex. flops ಠ_ಠ) look good without an actual improvement. The results should ideally demonstrate a consistent increase in at least one of the metrics, while keeping the other metrics stable when presenting the findings. The prevalent approach of presenting results as a tradeoff between model quality and training time is fundamentally flawed, as determining its usefulness can be challenging without additional context. In a graph displaying model quality (x-axis) against training time (y-axis), it becomes evident that, relative to the blue baseline, the violet point is always superior (higher quality with reduced time), and the yellow point is always inferior (lower quality with increased time). However, discerning the relative merits of the orange and green points is problematic.
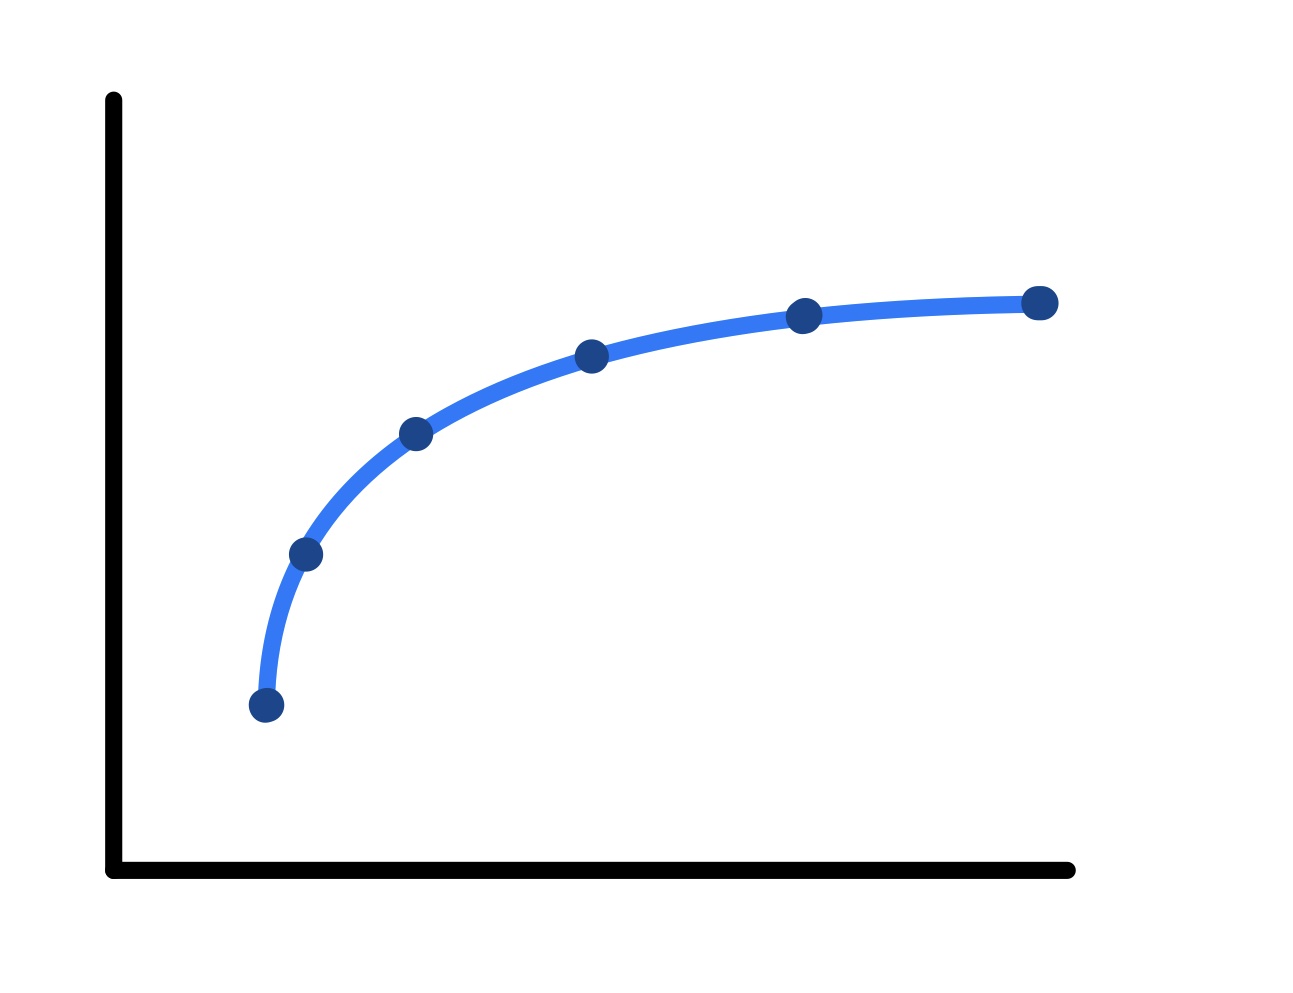
To address this issue, we plot the baseline at various training times and interpolate the points.
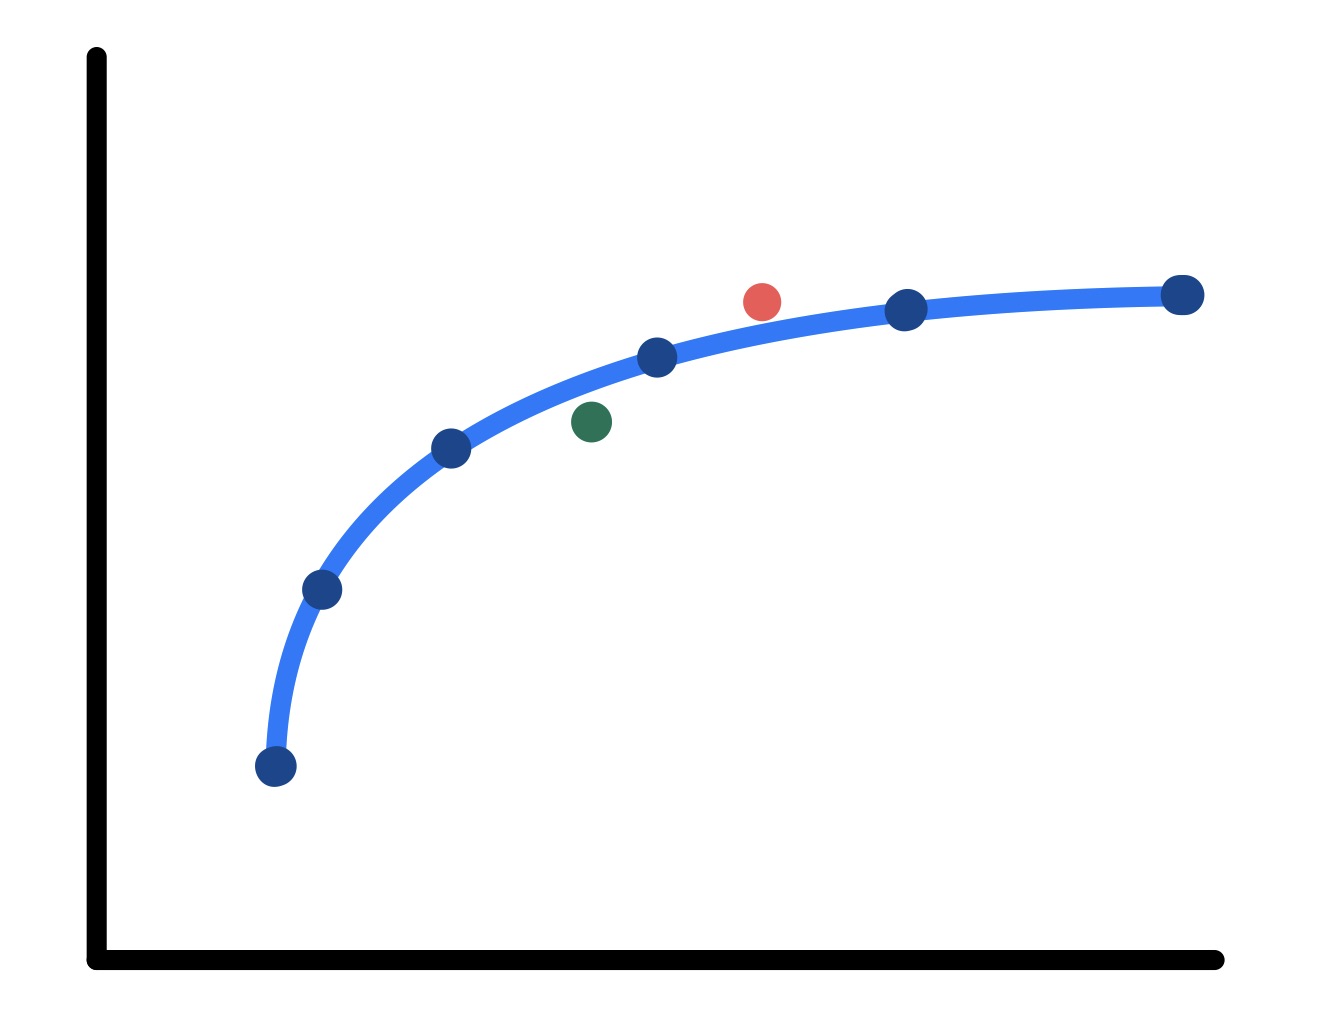
This visualization simplifies the comparison of the points, revealing that the orange point is indeed superior, while the green point is inferior. As a result, these findings can be depicted as a strict increase in a single metric.
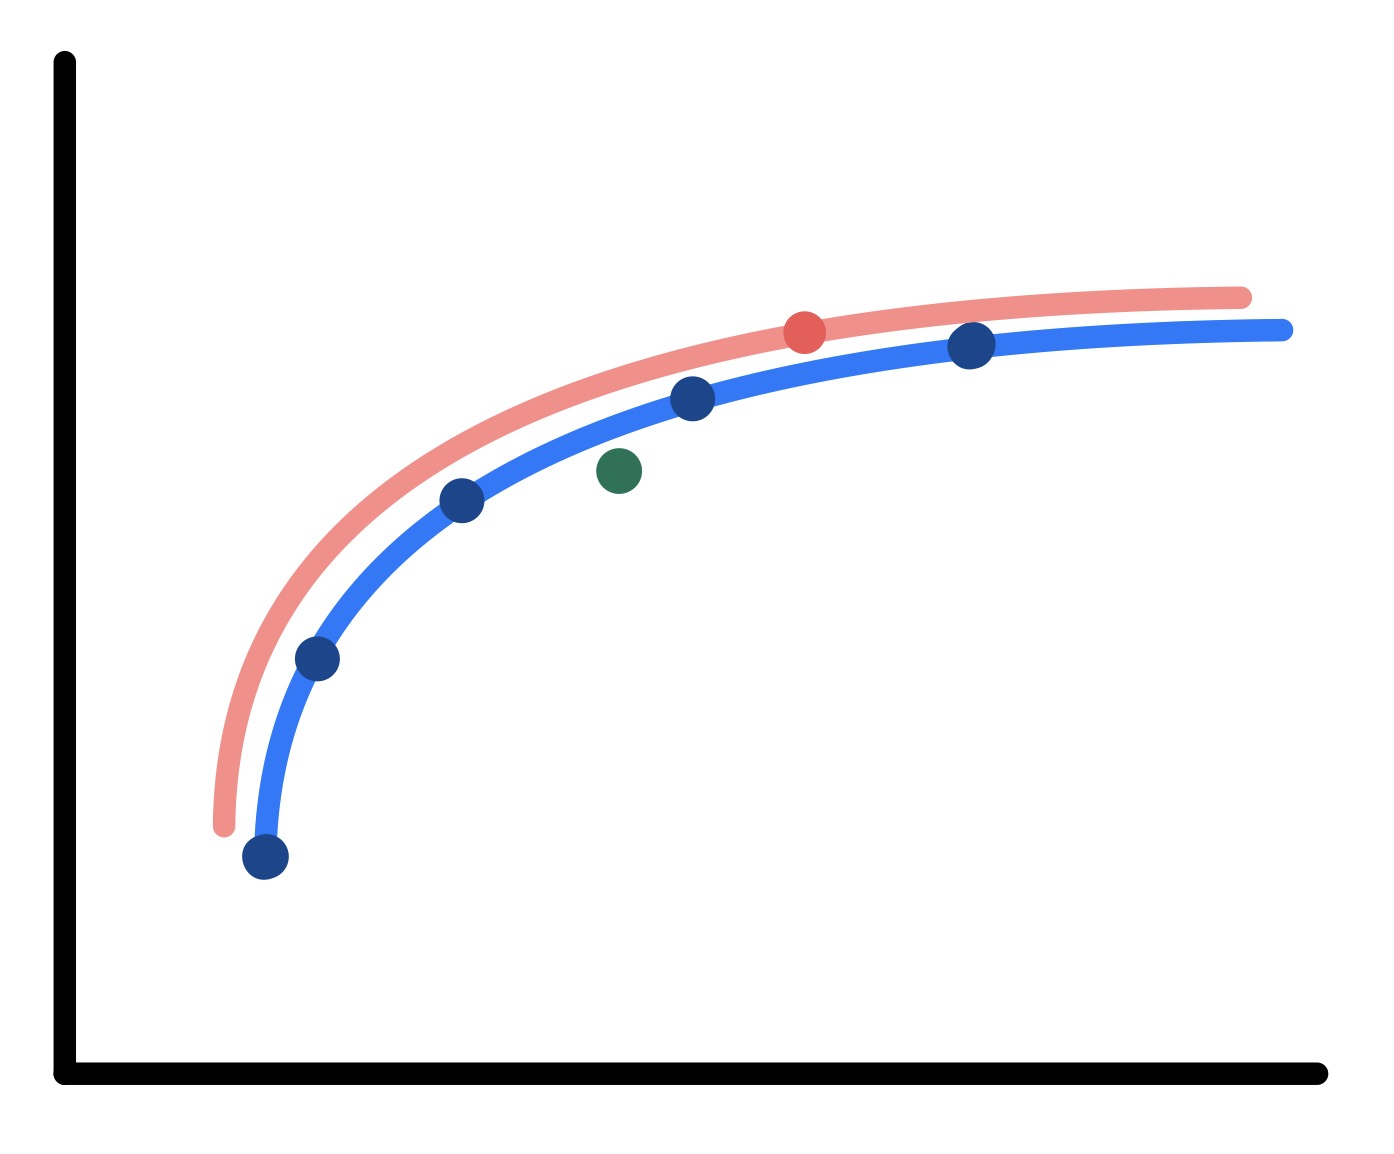
Furthermore, it turns out that the result usually allows the generation of a new curve based on the orange framework.
A better understanding of why techniques are effective or not, grounded in the scientific method, can lead to better results. Memory bottlenecks occur frequently, yet, surprisingly, few researchers seem to know a GPU’s memory capacity. Understanding where bottlenecks occur allows better training methods and model design that would allow us to drastically decrease model training time. For example, using AWS’s best GPUs to train ResNet-50 will be bottlenecked on the CPU and thus not use the full potential of the GPU. Multinode training on both GCP and AWS gets bottlenecked by the interconnect. Understanding these bottlenecks allow more efficacious model design.
This paradigm extends to individual methods as well. For example, Cutout works well; even without a robust or universally accepted theoretical understanding for why it works, we can further optimize Cutout. Because convolutions are rectangular, Cutout does not contribute to any training speedup. Instead, if we restrict the cutout to span the entire height or width of an image, the image size is reduced and thus training is accelerated. We may then transition from this to stronger regularization methods, such as traditional Cutout, as needed. However, if we know that we are bottlenecked on the GPU, we would try to avoid Mixup type regularization methods, despite the stronger regularization, as it would significantly increase training time by loading twice the as many examples. Software constraints must also be considered. We can achieve approximately a 30% speedup by pruning low loss examples from the backward pass, as it is more expensive and low loss examples contribute minimally. However, PyTorch autograd does not permit this. Therefore, assuming we do not want to rewrite autograd, we instead use a progressive resizing-inspired approach by running a forward pass on downscaled examples and both passes on our pruned examples. By understanding these paradigms, we can develop better machine learning models through a scientific approach.
In general, the effectiveness of most methods varies across domains and may produce adverse interactions with other methods. There is considerable potential for optimization of machine learning models, especially as the field moves toward larger models, where much of what is included in the model is not well understood and likely contributes minimally to the model. Numerous extremely important questions remain unanswered, such as the possibility of using small/bad models to accelerate larger/better models, the cause of large model loss spikes, and whether RLHF can work outside reinforcement learning, to name a few. A systemic, scientific approach to understanding the phenomena driving machine learning is imperative to propel the field forward and create truly innovative and effective models.