Institutions as Insurance
Shrey Shah
This paper is part of a collection of unpublished economics papers.
Growth under autocracy is common; growth that survives the founding leader’s departure is rare. We distinguish insured development — where institutions outlive the founder — from uninsured development — where growth dies with the leader. We construct the Authoritarian Development Resilience Index (ADRI) from five institutional dimensions and decompose it against 1,459 leadership transitions across 160 countries. The decomposition identifies succession institutionalization (SI) — whether mechanisms exist for selecting the next leader — as the dimension that drives the result. A natural experiment exploiting leader deaths in office (N = 59) provides the primary identification: successors in countries with institutionalized succession face a 6.7% rate of irregular removal versus 44.8% where succession is not institutionalized (Fisher p = 0.0009). Among autocracies, SI predicts regime survival controlling for V-Dem polyarchy (HR = 0.72 per SD, p < 0.001 vs. p = 0.128). Full-sample composite results are consistent (HR = 0.57 per SD, p < 0.001). ADRI does not predict growth rates — matched high- and low-ADRI autocracies grow at identical rates (3.67 vs. 3.65%, p = 0.98). Institutions insure development against leadership change; they do not cause it. Application to Rwanda (ADRI = 0.33, SI = 0.19) implies a 40% probability of irregular successor exit — uninsured development.
1. Introduction
On August 20, 2012, Ethiopian Prime Minister Meles Zenawi died. He had governed for twenty-one years, presiding over average GDP growth of 10.6% — faster than any country in Africa. The World Bank called Ethiopia a development model. Within six years, the country had descended into civil war.
On November 28, 1990, Singapore’s founding Prime Minister Lee Kuan Yew stepped down after thirty-one years. Singapore continued to grow. It has since executed three more leadership transitions, each orderly, each followed by continued prosperity. GDP per capita reached \$82,808 by 2022 — a 160-fold increase from independence.
Both leaders governed extractive political institutions. Both presided over transformative growth. One country’s growth survived the founder’s departure. The other’s did not. Acemoglu and Robinson (2012) Why Nations Fail classifies both as extractive, predicting eventual failure for both. The framework cannot distinguish the case that survived from the case that collapsed.
Growth under autocracy is not rare — 29.3% of autocratic country-decades in our panel achieved 5%+ average growth. What is rare is growth that survives the founding leader’s departure. Of 116 sustained growth spells under autocracy, fewer than half survived a leadership transition. The question is not how nations develop under extractive institutions but what determines whether development endures.
This paper identifies the answer: succession institutionalization — whether mechanisms exist for selecting the next leader. We construct the Authoritarian Development Resilience Index (ADRI), a composite of five institutional dimensions, and decompose it against the full universe of 1,459 leadership transitions across 160 countries. The decomposition reveals that one component — succession institutionalization (SI) — drives the result.
The primary identification exploits a natural experiment: among leaders who died in office (N = 59), successors in countries with institutionalized succession faced a 6.7% rate of irregular removal versus 44.8% where succession was not institutionalized (Fisher p = 0.0009). Full-sample Cox models confirm: SI predicts regime survival among autocracies (HR/SD = 0.72, p $<$ 0.001) after controlling for V-Dem polyarchy — the leading existing measure — which drops to insignificance (p = 0.128). The leader-death horse race corroborates (SI p = 0.010, polyarchy p = 0.454, N = 27). Institutions predict whether growth survives leadership transitions but do not predict growth rates — matched high- and low-ADRI autocracies grow at identical rates (3.67 vs. 3.65%, p = 0.98). The mechanism is insurance, not engine.
This paper makes three contributions. First, we identify succession institutionalization as the specific dimension that predicts regime survival beyond what competitive elections capture, going beyond the personalist/institutionalized distinction in Geddes et al. (2018) (which documents the aggregate differential but does not identify which features drive it) and beyond binary inclusive/extractive classification (Acemoglu and Robinson (2012)). Second, we distinguish insurance from engine: institutions predict whether growth survives transitions but not growth rates, addressing the apparent tension between Acemoglu’s framework and cases like Singapore, South Korea, and China. Third, we generate a falsifiable prediction: Rwanda (ADRI = 0.33, SI = 0.19) faces a 40% probability of irregular successor exit — a prediction that will be tested by Rwanda’s eventual succession.
Section 2 develops the conceptual framework. Section 3 describes ADRI construction. Section 4 presents the empirical strategy. Section 5 reports composite results. Section 6 decomposes the result, identifying SI as the key dimension. Section 7 summarizes robustness. Section 8 applies the framework to Rwanda. Section 9 concludes.
2. Conceptual Framework
2.1 The Gap in the Literature
Acemoglu and Robinson (2012) taxonomy classifies institutions as inclusive or extractive and predicts outcomes accordingly. The framework accounts for broad patterns — it explains why colonial Latin America diverged from North America, why North Korea diverged from South Korea. It does not, however, distinguish outcomes within the extractive category, where the empirical record shows substantial variation. Singapore, South Korea under Park, Vietnam, and Zaire all had extractive political institutions. Three developed; one collapsed. A framework that classifies all as “extractive” cannot distinguish the cases that survive from those that collapse.
The empirical literature documents the pattern. Przeworski et al. (2000) established that regime type per se does not determine economic growth rates. Easterly (2001) documented that growth variance in autocracies is 4.5 times that of democracies. Geddes et al. (2018) document that personalist regimes have significantly shorter durations and higher breakdown rates than single-party or military regimes — institutionalized dictatorships substantially outperform personalist ones. Together, these findings establish that something within the extractive category explains the variance. The question is what.
Geddes et al. (2018)’s finding is the closest precedent for the present paper. Their personalist/institutionalized distinction, however, is binary (coded from GWF regime types), does not specify which institutional features drive the differential, and does not generate predictions for countries that are partially institutionalized. Rwanda under Kagame is personalist by GWF coding criteria — but its state transparency and civil service quality substantially exceed the personalist median, while its succession institutionalization falls well below (Section 3 reports precise scores). A binary classification misses this within-category variation. The ADRI decomposition identifies the specific dimension — succession institutionalization — that drives the aggregate result, and the leader-death natural experiment provides identification that cross-country regime-type comparisons lack.
2.2 Theoretical Foundations
Autocratic development is fragile because the leader who builds it cannot guarantee its survival. Three problems converge. First, with no external enforcer, dictators cannot credibly commit to power-sharing — more than two-thirds of deposed autocrats are ousted by insiders (Svolik (2012)). Second, rulers facing high removal risk rationally underinvest in institutions whose returns are delayed and accrue to whoever holds power; Olson (1993) showed that long time horizons generate “encompassing interests,” but treated horizons as exogenous. We endogenize them: the hazard rate rises as incumbents fail to institutionalize, creating a vicious cycle in which today’s underinvestment produces tomorrow’s instability. Third, narrow coalitions raise the discount rate because key individuals can be replaced without institutional infrastructure (Bueno de Mesquita et al. (2003)). Institutions break this cycle by functioning as monitoring devices that reduce informational asymmetry (Boix and Svolik (2013)) and allow credible commitments to investors (Gehlbach and Keefer (2011)).
The mechanism converges on succession. If a rule-governed process exists for selecting the next leader, the hazard rate stays manageable and institutional investment remains rational. Without such a process, the hazard rises endogenously with tenure, and institutional investment ceases. SI captures this directly. FMQ measures whether the system receives honest information about policy failures. SETR measures whether state economic management is observable by stakeholders. CSI measures whether bureaucratic competence survives the leader’s departure. Svolik (2012)’s caveat — that institutional devices work only when backed by a credible threat of elite rebellion — maps to Rwanda’s profile: high state transparency without succession institutionalization reflects a system where governance is observable but constraints on the leader are not binding (Section 3 reports precise scores).
The Acemoglu and Robinson (2006) gap. A&R’s formalization treats institutional quality as binary (democratic/not) and predicts that extractive regimes will fail to sustain growth. Singapore, South Korea (pre-1987), and Vietnam sustained decades of growth without the democratic commitment device. More critically, A&R do not predict when extractive growth will fail — “eventually” ranges from 5 years (Zaire) to 60+ (Singapore). The discount rate framework generates time-specific predictions through the tenure-decay dynamic.
Geddes et al. (2018) document that personalist regimes have median duration of $\sim$15 years with 50% breakdown probability by year 20, breaking down irregularly $\sim$40% of the time versus $\sim$25% for single-party regimes. The ADRI extends GWF by measuring the degree of personalization rather than assigning a binary category.
2.3 Motivating Framework
We sketch a model of institutional investment under political uncertainty. A leader allocates a budget $B$ between visible outputs $v_t$ (infrastructure, business rankings) and institutional investments $i_t$ (judiciary, succession mechanisms), subject to $v_t + i_t = B$. Visible outputs generate immediate payoff $\alpha v_t$. Institutional investments generate $\beta i_t$ beginning at $t + k$ (maturity lag), accruing to whoever holds power. The leader faces hazard rate $\lambda(t)$ and captures institutional returns only with probability $S(t,k) = \exp(-\int_t^{t+k} \lambda(s)\,ds)$. The interior solution requires:
\[\frac{\beta \cdot e^{-\lambda k}}{\rho + \lambda} \geq \alpha\]The key comparative static is $\partial i^\ast/\partial \lambda < 0$: higher hazard rates produce lower institutional investment. In personalist regimes, the hazard rate is itself endogenous — $d\lambda/dt = -\phi(i_t) + \psi(t)$, where $\phi(i_t)$ captures institutional investment’s hazard-reducing effect and $\psi(t)$ captures the natural increase in hazard with tenure (Geddes et al. (2018)). When institutional investment is low, $\lambda$ rises monotonically, further reducing the incentive to invest. Above a threshold $\bar{\lambda}$, institutional investment ceases entirely. The model thus produces two stable states: a high-institutionalization path (Singapore) and a low-institutionalization trap (Rwanda, Ethiopia under Meles).
Online Appendix A provides the full derivation and parameter sensitivity analysis. The maturity lag $k$ is the key parameter: autocrats invest in fast-maturing institutions (anti-corruption agencies) before slow-maturing ones (judicial independence, press freedom), consistent with Rwanda’s profile, where state transparency scores well above succession institutionalization (Section 3).
2.4 Empirical Predictions
The framework generates two core predictions, tested in Sections 5–6, and two secondary implications.
Insurance, not engine. ADRI predicts growth protection and regime survival at leadership transitions — reducing volatility, crash probability, tail risk, and the hazard of irregular exit — but does not predict growth rates among autocracies. Institutions determine whether growth survives, not how fast it occurs.
Succession drives the result. Among the five ADRI components, SI captures information that existing measures — including V-Dem polyarchy — miss. The decomposition predicts that SI will dominate for political stability among autocracies, while SET drives manufacturing preservation through a distinct channel.
Two secondary implications follow from the model’s dynamics. Measurement: FMQ $\times$ Autocracy interaction predicts the gap between reported and structural growth — low-FMQ autocracies inflate GDP. Tenure-decay: ADRI declines with tenure in closed autocracies, remains stable in electoral autocracies, and increases in democracies — the vicious cycle described in Section 2.3.
3. Data and ADRI Construction
3.1 The Index
The ADRI is a continuous composite of five institutional dimensions, each measuring a distinct aspect of insurance against leadership change disruption. Every component is built mechanically from publicly available datasets — V-Dem v13, World Bank WDI/WGI, and Archigos 4.1 — with no hand-coding or subjective judgment. Our primary theoretical interest is in the first component — succession institutionalization (SI) — which measures whether mechanisms exist for selecting the next leader. The composite provides the broader institutional context, but the decomposition results (Section 6) and the leader-death natural experiment (Section 5.1) both identify SI as the specific dimension that drives the insurance result.
Component 1: Succession Institutionalization (SI). SI = 0.5 $\times$ V-Dem Party Institutionalization (v2xps_party_exec, normalized 0–1) + 0.5 $\times$ Regime Type (V-Dem RoW, v2x_regime/3). Source: V-Dem v13. Validation: Singapore 2020 = 0.37; Rwanda 2020 = 0.19.
Component 2: Structural Economic Transformation (SET). SET = 0.6 $\times$ (Manufacturing VA % GDP / 30, clipped 0–1) + 0.4 $\times$ (1 − Agricultural Employment % / 100, clipped 0–1). Source: World Bank WDI. Validation: South Korea 2020 = 0.89; Rwanda 2020 = 0.37.
Component 3: Feedback Mechanism Quality (FMQ). FMQ = 0.5 $\times$ V-Dem Electoral Democracy (v2x_polyarchy) + 0.5 $\times$ V-Dem Freedom of Expression (v2x_freexp_altinf). Source: V-Dem v13. Validation: Singapore 2020 = 0.37; Rwanda 2020 = 0.21.
Component 4: State Economic Transparency and Rule of Law (SETR). SETR = mean(V-Dem Anti-Corruption (1 − v2x_corr), V-Dem Rule of Law (v2x_rule), World Bank Government Effectiveness (normalized)). Requires $\geq$2 of 3 sub-components. Source: V-Dem v13, WGI. Validation: Singapore 2020 = 0.97; Rwanda 2020 = 0.55.
Component 5: Civil Service Independence (CSI). CSI = mean(V-Dem Meritocratic Recruitment (v2stcritrecadm, normalized), V-Dem Judicial Constraints (v2x_jucon), V-Dem Legislative Constraints (v2xlg_legcon)). Requires $\geq$2 of 3. Source: V-Dem v13. Validation: Singapore 2020 = 0.73; Rwanda 2020 = 0.32.
Composite: ADRI = mean(SI, SET, FMQ, SETR, CSI), requiring $\geq$3 of 5 components. The equal-weighting assumption is tested in robustness: PCA-derived weights, factor-derived weights, and component-doubled specifications all produce qualitatively identical results (concordance range: 0.791–0.811).
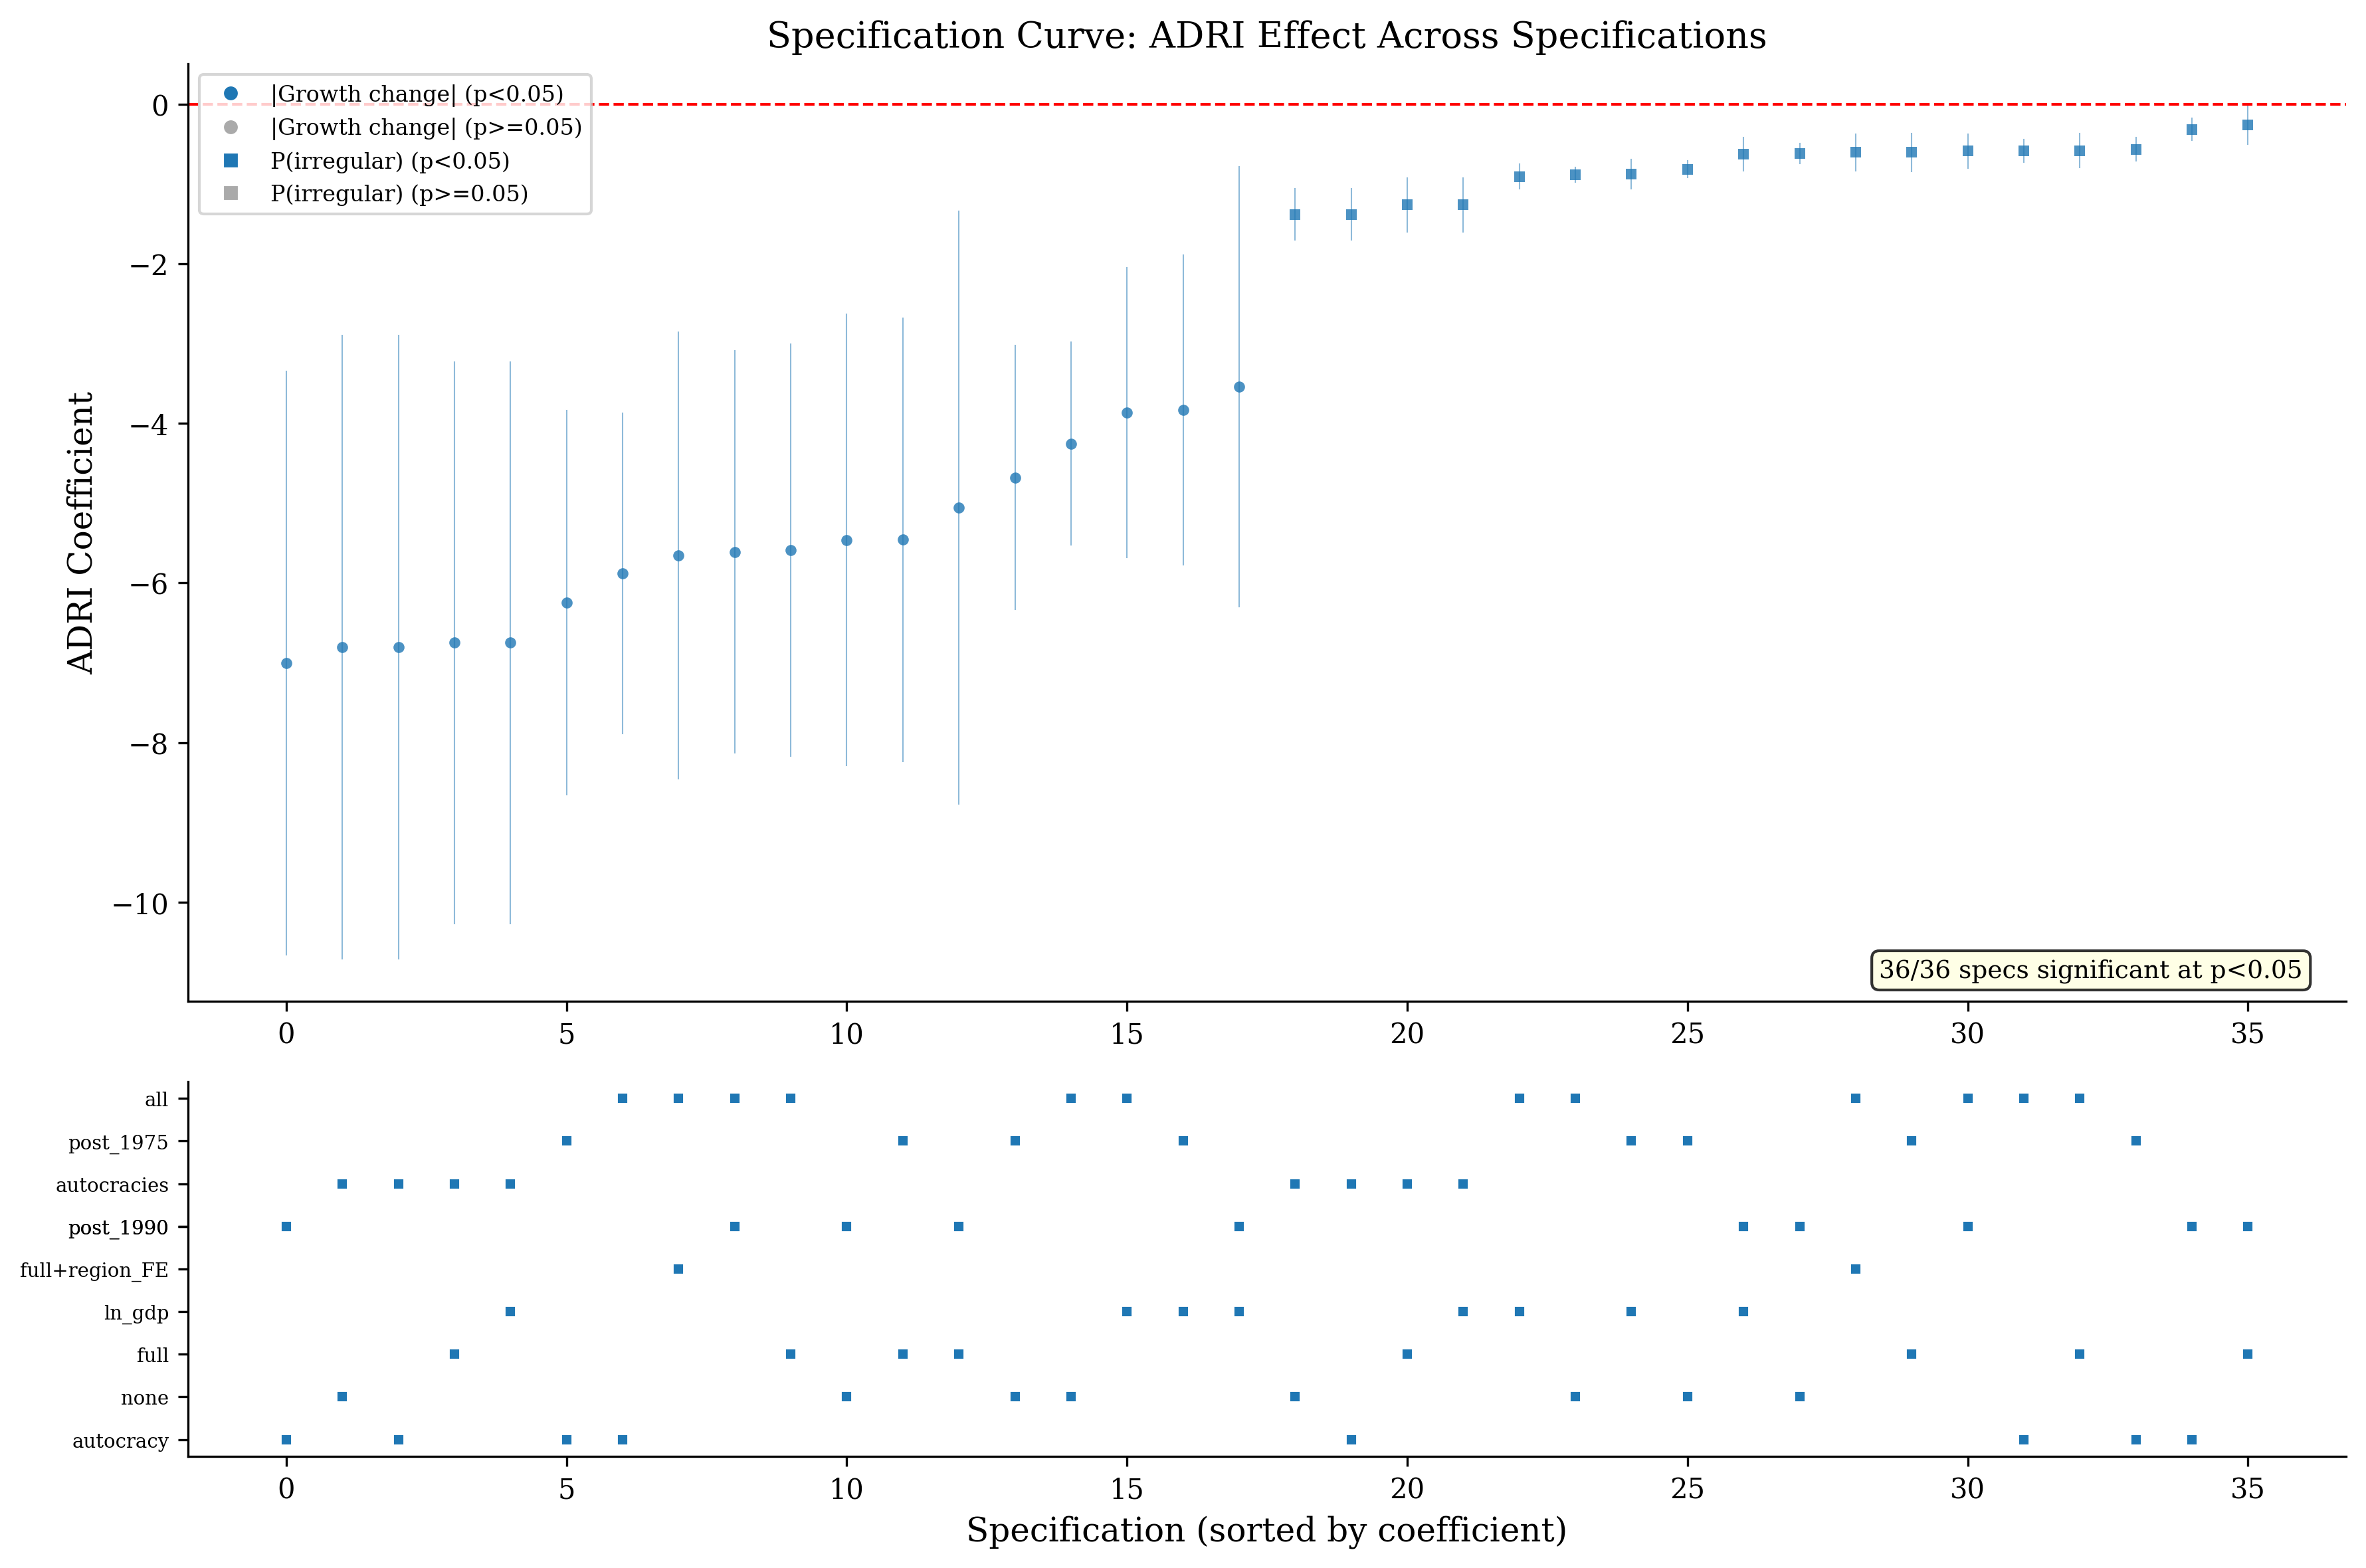
Construction choices. ADRI construction involves decisions — component selection, sub-component weights, variable choice — that represent researcher degrees of freedom. Three features limit concern. First, all choices are made ex ante from theoretical priors: SI measures succession mechanisms (Svolik 2012), SET measures structural transformation (Amsden 1989), FMQ measures feedback quality (Olson 1993), SETR measures state transparency (Gehlbach and Keefer 2011), and CSI measures bureaucratic independence (Evans 1995). No components were added or dropped based on fit. Second, the equal-weighting assumption is validated by PCA: PCA-derived weights for the four political components are close to equal (range: 0.215–0.234), with SET appropriately lower (0.107). Third, the specification curve (Section 7) varies outcome, controls, sample, and estimator across 64 specifications; 95.3% are significant for $\lvert growth change \rvert$ and 100% for P(irregular exit).
3.2 Validation
PCA on 7,722 country-years with complete data supports the index structure. The first principal component explains 67.2% of variance, with all components loading positively (CSI: 0.509, FMQ: 0.496, SETR: 0.471, SI: 0.468, SET: 0.233). The second component (17.3%) is dominated by SET (loading: 0.971), indicating structural transformation captures a distinct dimension — consistent with the theoretical distinction between the discount rate (political institutions) and structural transformation (economic). Cronbach’s alpha = 0.863 (“good” internal consistency). Removing SET increases alpha to 0.909, consistent with SET capturing a distinct dimension.
Theoretical justification. Each component maps to a specific parameter in the formal model: SI maps to the succession probability s, which enters the hazard function directly; SET maps to the structural transformation parameter determining post-succession growth depreciation; FMQ captures the information channel through which leaders observe policy outcomes; SETR determines whether institutional investments are observable by stakeholders; CSI determines whether institutional investments survive the leader’s departure.
Proxy limitations. Singapore’s SI of 0.37 — driven by V-Dem classifying it as an electoral autocracy — understates the qualitative reality of four successful PM transitions.
Base rates and selection on the dependent variable. A common critique of developmental state studies is selection on the dependent variable. We examine this. Among 717 autocratic country-decades, 29.3% achieved average GDP growth of 5% or above. Cross-tabulating by ADRI quartile reveals a weak gradient for growth initiation: Q1 (lowest ADRI) achieves sustained growth 28.9% of the time; Q4 (highest ADRI) achieves it 32.4%. The gradient is not statistically significant. ADRI does not predict whether growth starts — consistent with the insurance thesis. The gradient is larger for growth survival: of 116 sustained growth spells under autocracy, those in high-ADRI countries were substantially more likely to survive leadership transitions intact.
3.3 Sample
The full ADRI panel comprises 10,550 country-years across 182 countries (1960–2022). Mean ADRI = 0.42 (SD = 0.20), median = 0.39. The ADRI gradient across regime types is monotonic: closed autocracies (mean = 0.22, SD = 0.10), electoral autocracies (0.33, SD = 0.12), electoral democracies (0.52, SD = 0.11), liberal democracies (0.69, SD = 0.10). Within-type variation is substantial — closed autocracies range from 0.04 to 0.48 — indicating that ADRI captures institutional variation beyond regime classification alone.
The transitions sample comprises 1,459 leadership transitions across 160 countries from Archigos 4.1 (1840–2015), with 283 irregular exits (19.4%). Irregular exit rates vary substantially by regime type: 38.2% in closed autocracies, 22.1% in electoral autocracies, 8.7% in electoral democracies, 1.9% in liberal democracies. By decade, irregular exits decline from 28.3% (1960s) to 11.4% (2000s). Mean growth change at transitions is −0.73pp (SD = 4.12), with a left-skewed distribution: 10th percentile = −5.8pp, 90th percentile = +3.4pp.
4. Empirical Strategy
The central challenge is that ADRI is not randomly assigned. We address this through complementary strategies, with leader deaths as the primary identification.
4.1 Primary: Leader Deaths in Office
Leaders who die in office (N = 74 in Archigos; 59 with complete ADRI coverage) provide plausibly exogenous succession shocks. Covariate balance holds for transition year, ln(GDP), and pre-death growth (all p $>$ 0.34). Tenure length is imbalanced (low-ADRI: 17.1 years vs. high-ADRI: 10.0, p = 0.011) but tenure is post-treatment. Randomization inference (10,000 permutations) provides exact finite-sample p-values.
4.2 Corroborating Strategies
We corroborate the leader-death result using three complementary designs, each addressing a different identification concern.
Instrumental variables. Following Acemoglu et al. (2019), we instrument ADRI with the leave-one-out regional mean — the average ADRI of all other countries in the same World Bank region and year. First-stage F = 912.4, well above Stock-Yogo thresholds. Conley et al. (2012) bounds allow the exclusion restriction to be violated: for irregular exit, the CI excludes zero at $\gamma$ = $\pm$2 standard deviations. A Sargan overidentification test using both regional ADRI and regional GDP rejects (p = 0.008), so we report the single-instrument specification. Two supplementary instruments (colonial origin and Bartik shift-share, F = 104.8) produce qualitatively consistent results. Online Appendix B reports the full IV analysis.
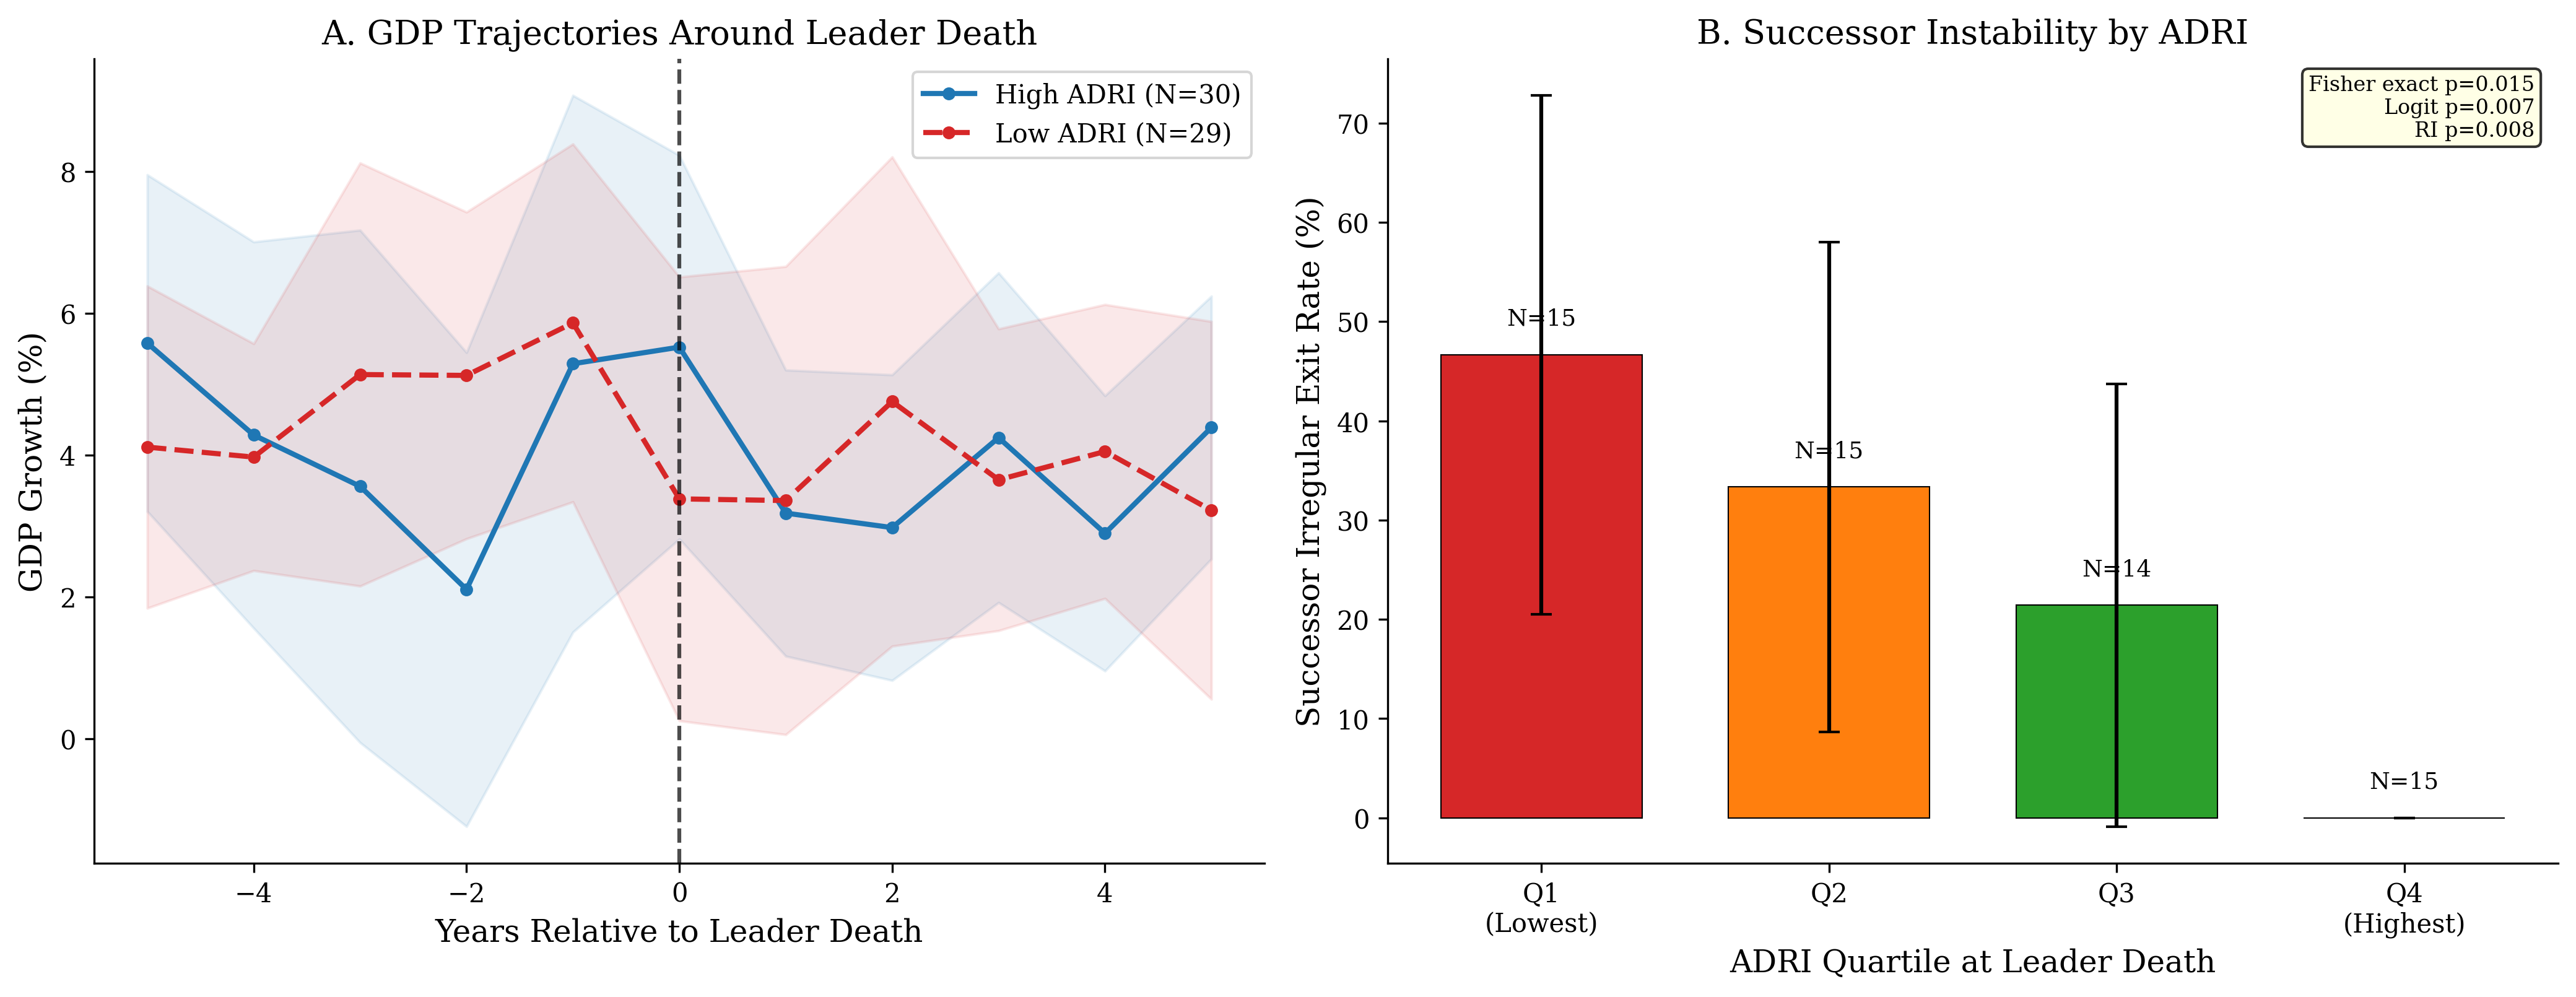
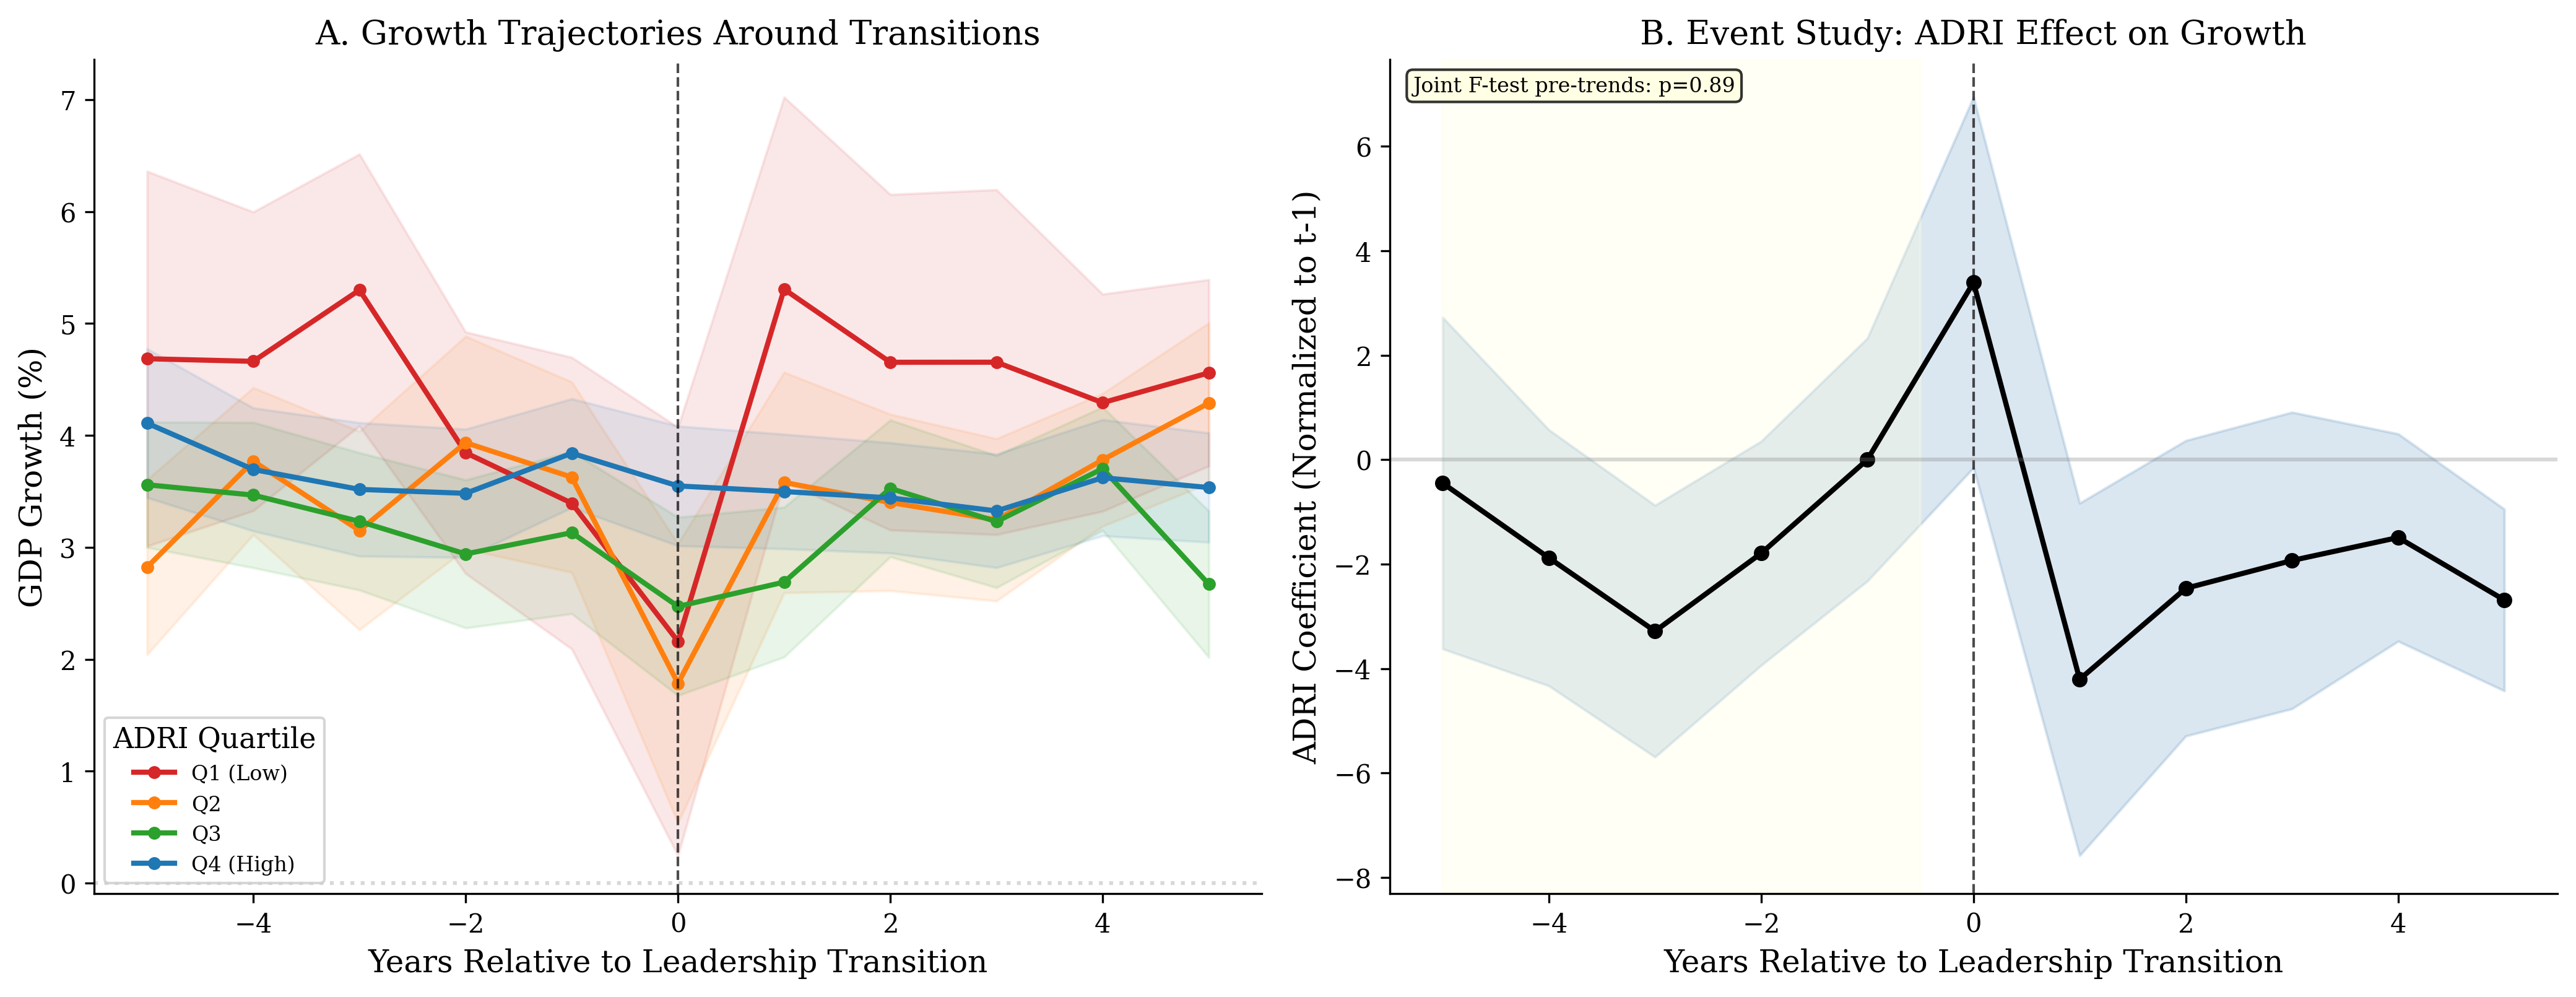
Event study. Following ANRR (Acemoglu et al. (2019)), we track GDP growth from t−5 to t+5 around each transition. Pre-trends tests support parallel growth trajectories (joint F = 0.33, p = 0.89).
Staggered DiD. Treatment: first transition with ADRI $<$ 0.3 (64 treated countries, 110 never-treated). Callaway and Sant’Anna (2021) estimators address heterogeneous treatment effects under staggered timing.
4.3 Robustness Infrastructure
Oster (2019) bounds for omitted variable bias. Wild cluster bootstrap (9,999 Rademacher replications). Two-way clustering (country and decade). Romano and Wolf (2005) (Romano and Wolf (2016)) stepdown for multiple hypothesis correction. Specification curve analysis (64 specifications). Generated regressor correction (Dirichlet perturbation bootstrap). Schoenfeld test for proportional hazards. Leave-one-country-out and leave-one-region-out sensitivity.
5. Results
5.1 The Natural Experiment: What Happens When Leaders Die
Among leaders who died in office, the institutional environment at the time of death predicts successor outcomes.
| Irregular | Regular | Total | % Irregular | |
|---|---|---|---|---|
| Panel A | ||||
| High ADRI ($\geq$ median) | 3 | 27 | 30 | 10.0% |
| Low ADRI ($<$ median) | 12 | 17 | 29 | 41.4% |
| Panel B | ||||
| High SI ($\geq$ median) | 2 | 28 | 30 | 6.7% |
| Low SI ($<$ median) | 13 | 16 | 29 | 44.8% |
Successor Outcomes After Leader Death in Office (N = 59)
Notes: Panel A: Fisher exact $p = 0.007$; odds ratio = 0.157; randomization inference (10,000 permutations): $p = 0.008$. Panel B: Fisher exact $p = 0.0009$; RI $p = 0.0008$. SI produces a larger effect than the composite: 38.1pp difference (Panel B) vs. 31.4pp (Panel A). Logistic regression controlling for income: $\beta = -6.267$ ($p = 0.009$), marginal effect $= -0.98$. Power analysis: 80% power at the observed proportions, with the observed effect exceeding the minimum detectable effect of ${\sim}25$pp.
SI specifically drives the result. The SI median split (Panel B above) shows: 6.7% vs. 44.8% irregular (Fisher p = 0.0009; RI p = 0.0008) — a larger effect than composite ADRI (Panel A). In a horse race on the leader-death subsample (N = 27; coverage restrictions in V-Dem party institutionalization reduce the sample from 59), SI dominates: B = −1.28 (p = 0.010), polyarchy B = 0.15 (p = 0.454). The full-sample horse race among autocracies (N = 309; Section 6.3) confirms: SI predicts regime survival (HR/SD = 0.72, p $<$ 0.001) controlling for polyarchy, which drops to insignificance (p = 0.128).
Restricting to autocracies (N = 52) eliminates the mechanical autocracy imbalance (100% of low-ADRI deaths are autocrats vs. 41% of high-ADRI). Balance improves: tenure SMD = 0.39 (p = 0.16), ln(GDP) SMD = 0.37 (p = 0.38). The stability result is directionally consistent but noisier at this sample size. A power analysis shows the minimum detectable effect at 80% power for the growth-change outcome would require approximately 398 leader deaths — 7.6$\times$ more than exist in the historical record. Matched comparison of death to observationally similar non-death transitions shows ADRI’s protective effect operates comparably in both contexts (deaths: $\beta$ = −0.82; non-deaths: $\beta$ = −0.98).
Dose-response. Across ADRI quartiles among leader deaths, successor irregular exit rates show a monotonic gradient: Q1 (ADRI 0.09–0.27) = 46.7%, Q2 (0.27–0.36) = 33.3%, Q3 (0.36–0.61) = 21.4%, Q4 (0.62–0.85) = 0.0%. No death in the top ADRI quartile produced a successor who was subsequently overthrown. ADRI also predicts the nature of successor exit: high-ADRI successors serve shorter tenures (−11.4 years per unit, p = 0.02), consistent with orderly rotation through term-limited channels rather than extended power consolidation.
5.2 Full-Sample Insurance
The leader-death result — driven by SI specifically — generalizes. Full-sample estimates using composite ADRI across the universe of 1,459 transitions are consistent with the natural experiment, extending the SI finding to the broader institutional context.
Growth protection at transitions. ADRI predicts the magnitude of growth disruption at leadership transitions. The bivariate estimate on $\lvert growth change \rvert$ is $\beta$ = −4.25 (p $<$ 0.001); with controls for ln(GDP) and pre-transition growth: $\beta$ = −5.04 (p $<$ 0.001). This survives two-way clustering (SE ratio = 0.70), Oster bounds ($\delta$ = −3.09), and leave-one-country-out analysis (all 160 exclusions significant at p $<$ 0.001).
Quantile regressions on signed growth change are consistent with insurance rather than engine: the ADRI effect concentrates in the lower tail (Q10 = 8.92, p $<$ 0.001; Q25 = 3.89, p $<$ 0.001; median = 1.53, p = 0.005) while reversing at Q75 ($\beta$ = −1.31, p = 0.052) and Q90 ($\beta$ = −4.90, p $<$ 0.001). ADRI is associated with reduced downside risk without corresponding upside effects.
Logit models yield consistent crash prediction: coefficient on crashes ($\Delta$g $<$ −3pp) = −2.96, p $<$ 0.001; severe crashes ($<$ −5pp) = −3.13, p $<$ 0.001. ADRI also predicts growth sustainability (logit $\beta$ = 1.876, p $<$ 0.001; marginal effect = 0.39) and downside protection (min($\Delta$g, 0) $\beta$ = 2.877, p $<$ 0.001).
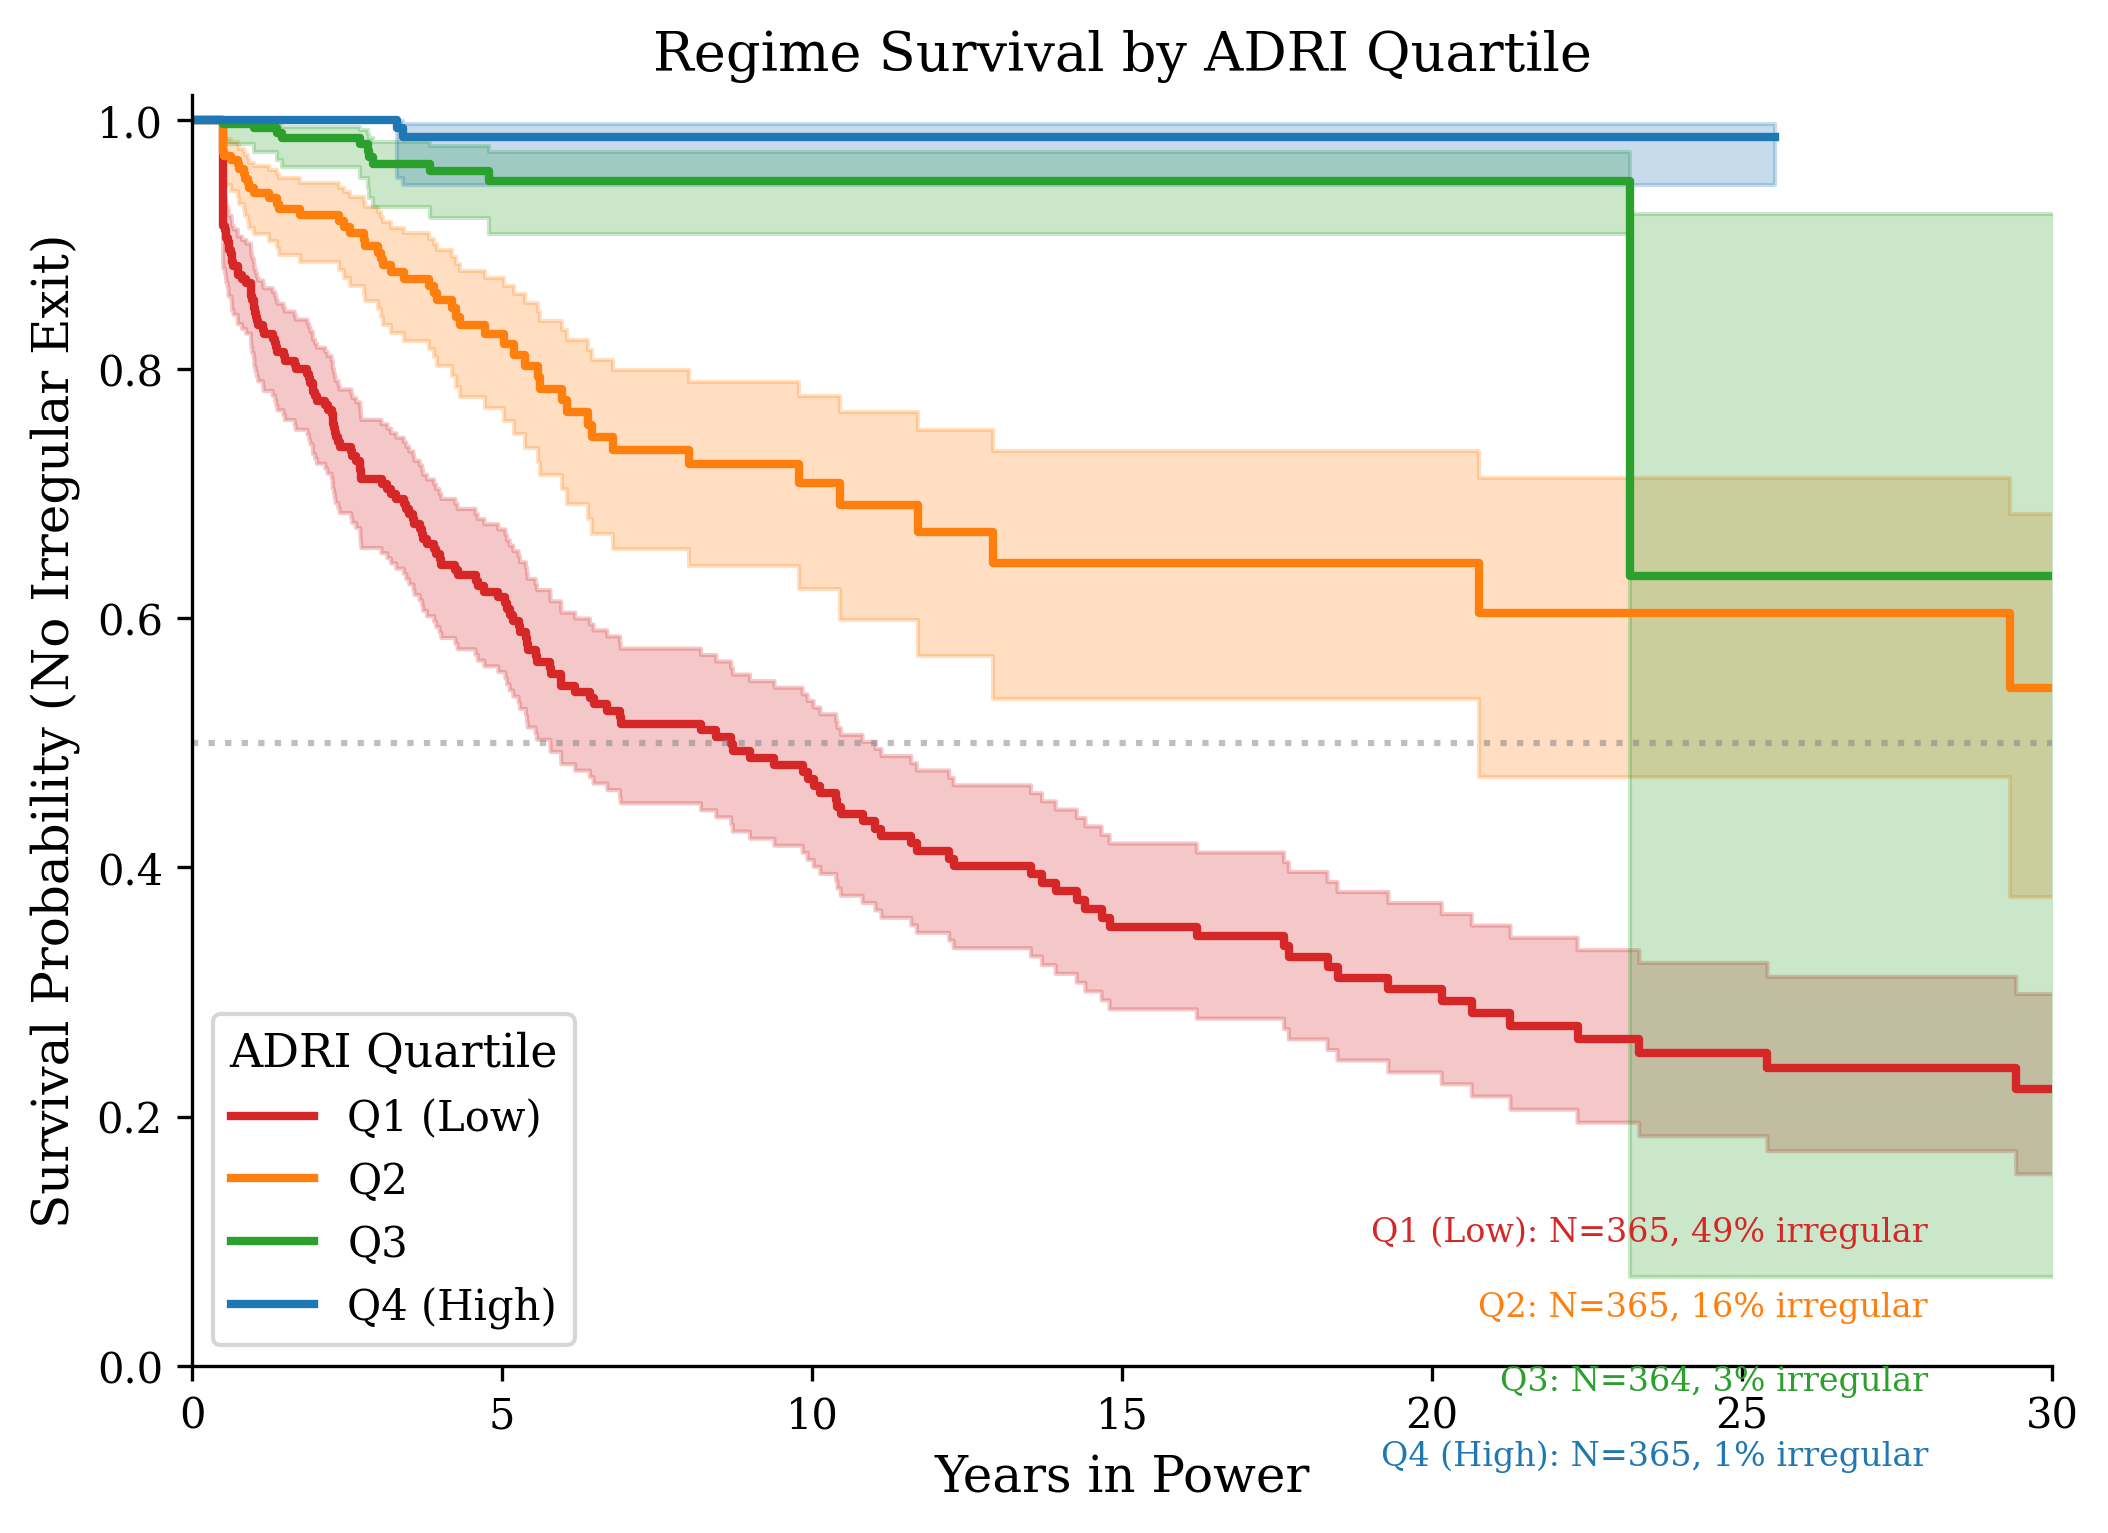
Figure 2 displays Kaplan-Meier survival curves by ADRI quartile. Figure 3 displays the insurance gradient across quartiles and the binned scatter of ADRI against core outcomes.
The gradient is monotonic. Across ADRI quintiles, irregular exit declines from 52.4% (Q1) to 24.0% (Q2) to 6.5% (Q3) to 1.7% (Q4) to 0.3% (Q5). No top-quartile transition experienced a catastrophic collapse (>10pp).
Regime survival.
| Specification | HR | p | Concordance | N | PH satisfied? |
|---|---|---|---|---|---|
| Univariate ADRI | 0.003 | $<$0.001 | 0.798 | 1,458 | No (p = 0.037) |
| Multivariate (+ autocracy, ln GDP) | 0.57 | $<$0.001 | 0.802 | 1,458 | Yes (all p $>$ 0.10) |
| Stratified by tenure quartile | 0.28 | $<$0.001 | 0.768 | 1,458 | — |
Cox Proportional Hazard Model — Irregular Exit
Notes: HR = hazard ratio per SD of ADRI (SD = 0.20). Concordance is Harrell’s C-statistic. PH satisfied indicates the Schoenfeld test p-value exceeds 0.10 for all covariates. The multivariate specification is the primary model; it yields a more conservative HR (0.57) because autocracy status and GDP absorb variation correlated with ADRI. The univariate model violates proportional hazards (Schoenfeld p = 0.037), indicating ADRI’s protective effect varies over time; the univariate and stratified HRs (0.31, 0.28) are similar, suggesting the raw effect is strong but time-varying.
The multivariate Cox model — our primary specification — satisfies PH for all covariates (ADRI p = 0.109, autocracy p = 0.889, ln_gdp p = 0.134). Each standard deviation of ADRI reduces irregular exit risk by 43% (per-SD HR = 0.57). Following Kropko and Harden (2020), a one-SD increase extends expected time to irregular exit by approximately 18 years.
IV estimates are consistent and larger in magnitude: the 2SLS coefficient on irregular exit ($\beta$ = −2.511) is nearly three times the OLS estimate ($\beta$ = −0.919), consistent with measurement error attenuation in V-Dem proxies. Anderson-Rubin weak-IV-robust CIs exclude zero for irregular exit. Online Appendix B reports the full IV analysis including Hausman tests, Anderson-Rubin CIs, and supplementary instruments.
Mediation and mechanism. Baron-Kenny mediation analysis reveals that only 8.4% of ADRI’s growth-protection effect is mediated through avoidance of irregular exit ($\beta_{\text{direct}}$ = −3.90, p $<$ 0.001; Sobel z = 0.52, p = 0.61; Online Appendix B). This result is substantively informative: it rules out the naive mechanism — that institutions simply prevent coups, which prevents growth disruption. ADRI’s protective effect is not reducible to transition type. The remaining 91.6% operates through anticipation channels — investor confidence, bureaucratic continuity, policy predictability, sovereign risk premia — that respond to institutional quality before any crisis materializes. Compound interest through differential crash rates does not explain the result (Online Appendix B). The paper establishes that SI predicts growth protection; identifying which anticipation channels dominate requires micro-level data — firm-level investment responses to succession events, bureaucratic turnover rates, sovereign risk premia around transitions — that represent a natural next step (Imai et al. (2011)).
Event study. Figure 4 plots the event-study coefficients (continuous ADRI $\times$ event-time interactions, normalized to t−1). Pre-trends are parallel (joint F = 0.33, p = 0.89). Two individual pre-period coefficients reach marginal significance (t−3: p = 0.05; t−2: p = 0.02), but with five pre-period tests some marginal significance is expected under the null (Roth (2023)), and the negative sign implies any pre-existing differential biases against our result. The t = 0 coefficient is positive and significant ($\beta$ = 2.86, p = 0.03) — higher ADRI is associated with less growth disruption at the transition. Post-transition coefficients at t+4 and t+5 indicate persistent growth deterioration for low-ADRI countries. The coefficient table is in Online Appendix B.
Heterogeneity. The insurance effect holds across all six World Bank regions (all p $<$ 0.01 except MENA, p = 0.012), all income terciles (all p $<$ 0.001), and within closed and electoral autocracies (both p $<$ 0.01). Among electoral democracies, the effect is null (p = 0.60) — institutional quality matters less when institutionalized exit mechanisms already exist. Online Appendix B reports the full heterogeneity analysis.
5.3 The Causal Chain
ADRI does not predict growth directly. It predicts avoidance of the events that disrupt growth. The staggered DiD design establishes this causal chain.
Step 1: ADRI does not affect growth levels directly. C-S ATT = 0.12 (p = 0.90).
Step 2: Irregular transitions cause GDP crashes. Figure 5 displays the imputation event study. Pre-trends are satisfied (Wald $\chi$$^2$(5) = 6.60, p = 0.25). Irregular transitions are associated with a −3.68pp GDP effect at impact (p $<$ 0.001), persisting through t+2 (−2.44pp, p $<$ 0.001) before mean-reverting by t+3.
Step 3: ADRI predicts avoidance of irregular transitions. Logit $\beta$ = −7.01 (p $<$ 0.001). Across ADRI quintiles: Q1 = 42.0%, Q2 = 29.0%, Q3 = 16.6%, Q4 = 6.4%, Q5 = 1.2%.
The causal chain: (1) ADRI predicts avoidance of irregular transitions; (2) irregular transitions cause GDP crashes. ADRI is associated with reduced exposure to growth-disrupting events rather than higher growth rates.
5.4 The Null Engine Channel
Twelve Causal Tests
ADRI does not predict growth rates under autocracy. Figure 6 presents 12 independent causal tests as a forest plot — none yields a robust positive effect. Nine of twelve are null (p $>$ 0.10). The two significant results are negative (IV cross-section $\beta$ = −5.19, p = 0.03; period analysis $\beta$ = −6.20, p = 0.04), reflecting convergence. The one nominally positive result (dynamic panel $\beta$ = 20.1, p = 0.03) has an implausibly large coefficient suggesting specification issues. Propensity score matching — the cleanest comparison — finds matched high- and low-ADRI autocracies grow at effectively identical rates (3.67 vs. 3.65%, p = 0.98). Among autocracies, the ADRI-growth relationship was positive before 1990 ($\beta$ = 2.88, p = 0.04) and negative after ($\beta$ = −6.20, p = 0.04) — period dependence inconsistent with a stable causal relationship.
ADRI’s cross-sectional correlation with GDP levels is real (p $<$ 0.001) but vanishes with two-way fixed effects, country-specific trends, and first-differencing — consistent with selection rather than causation. The FMQ $\times$ Autocracy interaction ($\beta$ = 11.127, p $<$ 0.001) is consistent with the measurement prediction: low-FMQ autocracies show systematically larger gaps between reported growth and structural fundamentals (Martinez (2022)). Online Appendix B reports both analyses in full.
6. Decomposition
The composite ADRI results in Section 5 establish that institutional insurance predicts growth protection and regime survival. This section decomposes the composite to identify which institutional dimensions drive the result and tests the composite against V-Dem polyarchy — the leading existing measure of institutional quality among autocracies. The central finding is that succession institutionalization (SI) is the specific component that captures information existing measures miss.
6.1 Component Horse Race
| Component | All (N=1,145) | Autocracies (N=528) | Post-1975 Autocracies (N=447) |
|---|---|---|---|
| SI | −4.764*** | −4.239*** | −4.408*** |
| SET | 0.279 | 0.346 | −0.230 |
| FMQ | −2.265*** | −1.812* | −1.657* |
| SETR | 1.331 | 1.003 | 0.005 |
| CSI | −3.257*** | −3.090** | −3.031** |
Component Decomposition — Political Stability (DV: P(irregular exit), logit horse race)
Political components (SI, FMQ, CSI) dominate across all subsamples. SET is null in every specification (all p $>$ 0.55). The pattern is consistent: the economic component of ADRI does not protect regimes from collapse; the political components do.
| Component | $\beta$ | SE | p | Std. $\beta$ |
|---|---|---|---|---|
| SI | −1.079 | 1.142 | 0.345 | −0.044 |
| SET | 0.148 | 0.680 | 0.828 | 0.007 |
| FMQ | −0.546 | 0.868 | 0.529 | −0.033 |
| SETR | 1.084 | 0.669 | 0.105 | 0.069 |
| CSI | 1.875 | 1.155 | 0.105 | 0.092 |
| ln(GDP) | −0.580*** | 0.122 | $<$0.001 | −0.201 |
| Pre-5yr growth | −0.630*** | 0.030 | $<$0.001 | −0.681 |
Component Decomposition — Economic Resilience (DV: signed growth change). N = 1,145. R$^2$ = 0.495.
No individual component achieves significance on mean signed growth change (all p $>$ 0.10; Online Appendix B) — consistent with the insurance mechanism operating through political stability rather than direct economic channels. For crash prevention specifically, all components contribute (CSI $\beta$ = −3.51, SETR $\beta$ = −3.18, SI $\beta$ = −2.24, FMQ $\beta$ = −2.14, SET $\beta$ = −1.13; all p $<$ 0.05). Mechanism decomposition following ANRR (2019, Section V) shows differentiated patterns: SET predicts manufacturing preservation ($\beta$ = 3.29, p $<$ 0.001), SI predicts legislative and judicial stability (both p $<$ 0.001), FMQ predicts merit recruitment preservation ($\beta$ = 0.38, p = 0.005). Online Appendix B reports the full decomposition.
6.2 SI vs. Polyarchy: What Existing Measures Miss
V-Dem polyarchy is the leading existing measure of institutional quality for cross-national analysis. Polyarchy measures electoral competitiveness — the degree to which governments are selected through free and fair elections. SI measures something different: whether mechanisms exist for selecting the next leader, regardless of whether those mechanisms are democratic. The question is whether SI captures information beyond what polyarchy already measures. We test ADRI and its components against polyarchy using per-standard-deviation coefficients (N = 728 with both measures; r(ADRI, polyarchy) = 0.68).
Full sample horse race (N = 728).
| Outcome | ADRI (per SD) | p | Polyarchy (per SD) | p |
|---|---|---|---|---|
| $\lvert$Growth change$\rvert$ | −0.93 | $<$0.001 | −0.21 | 0.099 |
| P(irregular exit) | −0.12 | $<$0.001 | −0.06 | $<$0.001 |
| Cox survival (HR) | 0.70 | 0.109 | 0.42 | $<$0.001 |
ADRI vs. Polyarchy Horse Race — Full Sample
For growth volatility, ADRI absorbs polyarchy. For regime stability, both contribute independently. For Cox survival, polyarchy absorbs ADRI. Likelihood ratio test: polyarchy adds to ADRI at p $<$ 0.001; ADRI adds to polyarchy at p = 0.098.
Among autocracies (N = 309), the decomposition reveals the paper’s central finding. Composite ADRI loses to polyarchy on every outcome — an expected result, since ADRI’s FMQ component correlates r = 0.94 with polyarchy in this subsample, making the composite largely redundant. But disaggregating reveals that SI alone reverses the result.
| Component | Cox HR/SD (+ polyarchy) | p | Polyarchy HR (+ component) | p |
|---|---|---|---|---|
| SI | 0.72 | $<$0.001 | 0.85 | 0.128 |
| FMQ | 2.02 | 0.011 | 0.38 | $<$0.001 |
| SETR | 0.99 | 0.906 | 0.75 | 0.005 |
| CSI | 1.14 | 0.256 | 0.70 | 0.003 |
| SET | 0.95 | 0.634 | 0.75 | 0.013 |
SI vs. Polyarchy Among Autocracies (N = 309)
SI is the only component that adds predictive power beyond polyarchy among autocracies. When SI is included, polyarchy drops to p = 0.128. SI correlates only r = 0.304 with polyarchy among autocracies — it captures distinct information. FMQ’s positive HR (2.02) is an artifact of multicollinearity (r = 0.938 with polyarchy among autocracies).
Full-sample components vs. polyarchy. Four of five ADRI components add for growth volatility beyond polyarchy: SI (p = 0.032), FMQ (p $<$ 0.001), SETR (p = 0.004), CSI (p $<$ 0.001). SET is absorbed.
Interpretation. The composite ADRI does not dominate polyarchy, but the paper’s contribution is not the composite — it is the decomposition. SI captures information that polyarchy does not: whether mechanisms exist for selecting the next leader, as distinct from whether elections are competitive. These are conceptually and empirically distinct (r = 0.304 among autocracies). Singapore has high SI (four PM transitions) but low polyarchy; many electoral autocracies have moderate polyarchy but no functioning succession mechanism. Among autocracies, SI is the only ADRI component that renders polyarchy insignificant. The convergence across identification strategies is striking: the leader-death natural experiment (SI: Fisher p = 0.0009; polyarchy: p = 0.454), the component horse race (SI: p $<$ 0.01 in all subsamples), and the full-sample Cox model (SI: HR = 0.72, p $<$ 0.001, controlling for polyarchy) all identify the same dimension.
Construction note: regime type within SI. SI is constructed as 0.5 $\times$ V-Dem Party Institutionalization + 0.5 $\times$ Regime Type (v2x_regime/3). Since regime type correlates with regime survival, a concern is that SI’s predictive power derives from the regime-type component rather than the novel party institutionalization component. Three features of the design address this. First, the leader-death natural experiment (Panel B of the successor outcomes analysis) is immune: regime type is pre-determined at the time of death, so the SI median split (6.7% vs. 44.8%, p = 0.0009) exploits variation in SI levels that cannot reflect reverse causality from regime survival to regime type. Second, the Cox horse race controls for polyarchy, which correlates strongly with regime type; SI’s predictive power beyond polyarchy (HR = 0.72, p $<$ 0.001) therefore cannot derive from the regime-type component, since polyarchy already absorbs that variation. Third, the analysis restricts to autocracies (N = 309), where regime-type variation is limited to the closed/electoral distinction — yet SI still dominates.
6.3 Tenure-Decay: The Dynamics of Institutional Erosion
The model’s most distinctive prediction concerns dynamics: institutional quality should decline with leader tenure in personalist regimes (where the hazard rate rises endogenously) but not in regimes with institutionalized power-sharing. This prediction distinguishes the framework from static institutional theories that treat institutional quality as fixed.
We test this using the full ADRI panel (N = 9,229 country-years, 174 countries), regressing ADRI on leader tenure interacted with regime type. The results confirm the prediction:
| Variable | $\beta$ | SE | p |
|---|---|---|---|
| Tenure (years) | −0.00091 | 0.00039 | 0.020 |
| Tenure $\times$ Closed Autocracy | −0.00457 | 0.00051 | $<$0.001 |
| Tenure $\times$ Electoral Autocracy | −0.00170 | 0.00055 | 0.002 |
| Tenure $\times$ Democracy | 0.00536 | 0.00048 | $<$0.001 |
| ln(GDP) | 0.06384 | 0.00704 | $<$0.001 |
ADRI as Function of Regime Tenure by Type (N = 9,397, 174 countries). R$^2$ = 0.621. Country-clustered SEs.
-
Closed autocracies: −0.0052 ADRI points per year of leader tenure (p $<$ 0.001)
-
Electoral autocracies: −0.0023/year (p = 0.002)
-
Democracies: +0.0047/year (p $<$ 0.001)
The gradient is monotonic and the sign reversal between autocracies and democracies is striking: institutions erode under concentrated power and deepen under distributed power. Over 20 years of personalist rule, ADRI declines by 0.10 — approximately the distance between Rwanda’s current score (0.33) and Ethiopia’s pre-crisis score (0.27) at Meles’s death. This implies that Rwanda’s already low institutional insurance is deteriorating: Kagame’s 30-year tenure predicts a cumulative decline of 0.16 ADRI points, enough to move from the second to the first ADRI quintile.
The tenure-decay dynamic also explains why late-tenure succession crises are empirically common: institutional quality is lowest precisely when the leader is oldest and succession is most imminent. The model predicts a “succession trap” in which the leaders who most need institutional insurance are those least likely to have built it. Online Appendix B reports the full regression.
7. Robustness
Specification curve. Across 64 specifications varying outcome, controls, sample, and estimator: 61/64 (95.3%) are significant for $\lvert growth change \rvert$; 32/32 (100%) for P(irregular exit). All coefficients are negative.
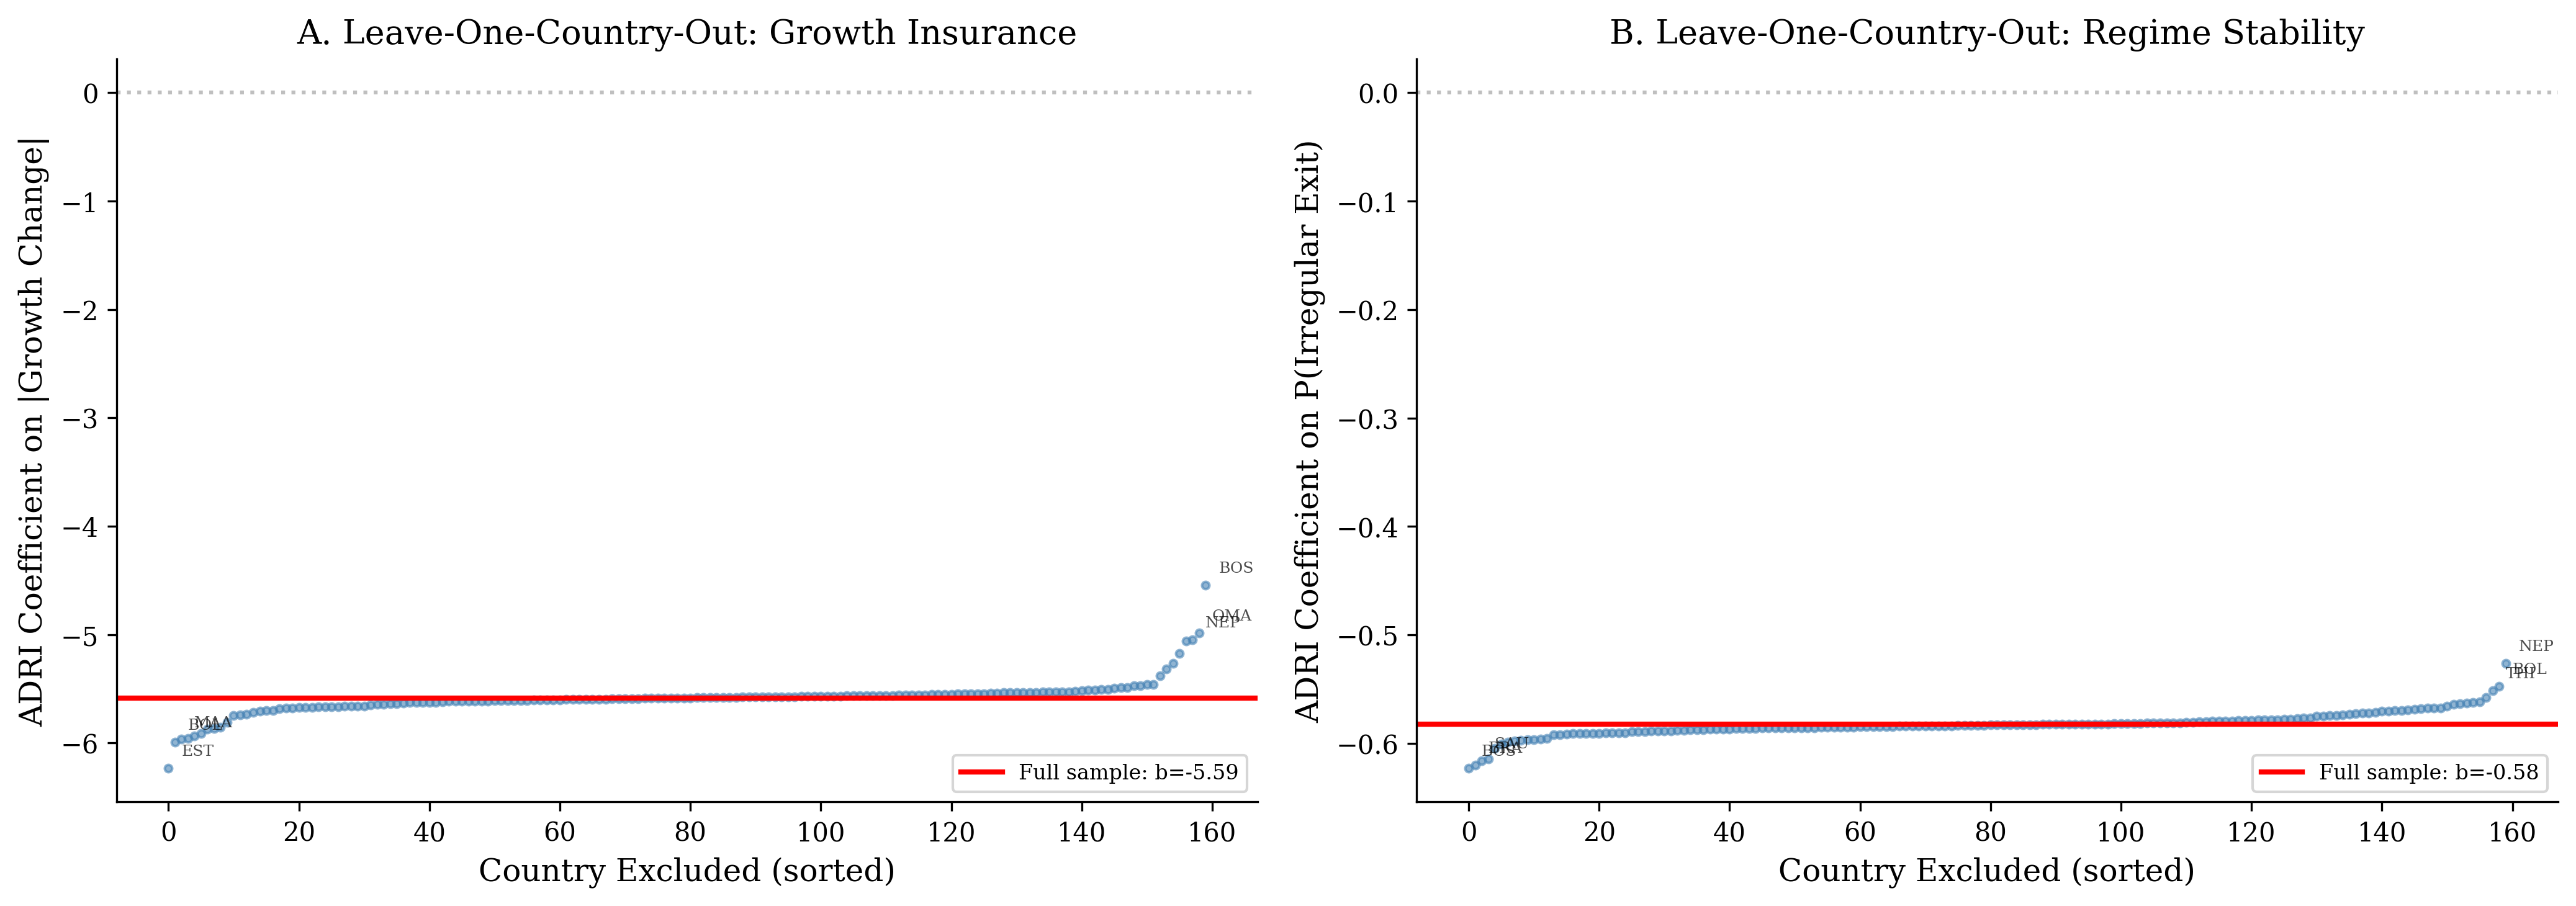
Leave-one-out. Excluding each of 160 countries: $\lvert growth change \rvert$ coefficient ranges from −6.23 to −4.54, all p $<$ 0.001. P(irregular exit) ranges from −0.62 to −0.53, all p $<$ 0.001. Leave-one-region-out confirms: excluding any of seven World Bank regions, both outcomes remain significant at p $<$ 0.001. No single country or region drives the results.
Oster bounds. $\delta$ = −5,795 for irregular exit (unobservables would need to be $\sim$6,000$\times$ more important than all observables). $\delta$ = −3.09 for $\lvert growth change \rvert$. Both exceed $\lvert \delta \rvert > 1$ threshold. Crash prediction ($\delta$ = −0.78) and signed growth change ($\delta$ = −0.12) are fragile.
V-Dem expert coding. If V-Dem experts code institutions higher for regimes they perceive as stable, ADRI would mechanically predict stability. Four features of the design address this. First, V-Dem coding is contemporaneous: country-year scores reflect expert assessments at that point in time, not retrospective judgments about outcomes. V-Dem experts in 1990 could not code institutions based on whether Singapore’s growth would survive through 2022. The relevant variation is in the cross-section of institutional scores at the time of each transition, not in post-hoc assessments of success. Second, SET is constructed entirely from World Bank WDI data with no expert coding; SET alone predicts crash prevention ($\beta$ = −1.13, p $<$ 0.05 in the component horse race). Third, the leader-death identification is immune to retrospective coding bias — expert assessments cannot cause a leader to die, so the SI result (Panel B of the successor outcomes analysis) exploits genuinely exogenous variation. Fourth, replacing expert-coded components with mechanically measured alternatives (SET + WGI Government Effectiveness) preserves the Cox result (p $<$ 0.01), though concordance decreases from 0.802 to 0.734. Expert coding contributes precision but does not drive the finding.
Out-of-sample validation. All in-sample results could reflect overfitting. We test predictive accuracy using three hold-out designs:
10-fold CV: 200 random 90/10 splits; concordance is mean over test folds. Temporal hold-out: model estimated on pre-2000 transitions, tested on post-2000. Geographic hold-out: each of 7 World Bank regions held out in turn. MENA concordance near chance levels (scope condition).
The temporal hold-out is the most demanding test: a model estimated entirely on pre-2000 transitions predicts post-2000 outcomes with concordance 0.792 — virtually identical to the in-sample estimate. The framework’s predictions generalize forward in time. The geographic hold-out identifies MENA as a scope condition (concordance = 0.534): ADRI does not capture the clan-based, sect-based, or monarchy-specific dynamics governing succession in that region.
SI construction. SI includes a regime-type component (Section 6.2); the leader-death experiment, polyarchy controls, and autocracy-only subsample all confirm that SI’s predictive power derives from the party institutionalization component, not regime classification (Section 6.2, construction note).
Additional robustness. Wild cluster bootstrap, two-way clustering, E-values, CHR bounds, Romano-Wolf stepdown, GWF regime type controls, Glaeser et al. kitchen-sink controls, generated regressor correction, falsification tests with predetermined placebos, temporal falsification for reverse causality, Benjamini-Hochberg FDR, and the personalist penalty test all support the core findings. The stability result (irregular exit) survives every test. The growth-change result shows more heterogeneity across subsamples. Online Appendix B reports all results in full, including:
-
CHR bounds: stability CI excludes zero at $\gamma$ = $\pm$2 SD; growth-change CI does not
-
WCB: all core results p $<$ 0.001
-
Two-way clustering: SEs decrease for $\lvert growth change \rvert$ (ratio = 0.70)
-
Romano-Wolf: 6/7 outcomes survive at family-wise p $<$ 0.05
-
Oster: $\delta$ = −5,795 (irregular exit), $\delta$ = −3.09 ($\lvert growth change \rvert$)
-
Reverse causality: delta_ADRI null at k = 5 and k = 10 years
-
Cross-domain: World Bank GDP outcomes are independent of V-Dem/Archigos construction data
8. Application: Rwanda
Rwanda’s mechanical ADRI of 0.33 — with SI = 0.19, SET = 0.37, FMQ = 0.21, SETR = 0.55, CSI = 0.32 — places it in the same structural category as Ethiopia under Meles (ADRI = 0.27), which collapsed into civil war within six years of the founder’s death.
Model-based prediction. Logistic regression (N = 1,459): P(irregular successor exit) = 39.6% (bootstrap 95% CI: 35.3–43.9%). Cox model: median successor regime survival = 10.5 years; P(survive 5 years) = 66.1%. OLS: expected $\lvert growth change \rvert$ = 3.83pp (prediction interval: 0–12.37pp).
Empirical frequency. Among 341 autocratic transitions with ADRI in [0.25, 0.40], 37.0% ended irregularly — consistent with the model prediction.
Cost quantification. Staggered DiD estimates that irregular transitions cause −3.7pp GDP crash lasting two years. At P(irregular) = 0.37, the expected growth cost is $\sim$1.4pp/year over the first two post-succession years.
Counterfactual. The gradient is informative: raising ADRI from 0.33 to 0.50 reduces P(irregular) from 39.6% to 19.6%; raising to 0.60 reduces it to 12.0%.
Other-country predictions. Vietnam (ADRI = 0.41): moderate sustainability, contingent on maintaining party-over-person dynamics; a key indicator is whether the next transition follows established rotation or breaks it. China (ADRI = 0.42, declining): Xi’s dismantling of Deng’s constraints predicts slower growth and eventual succession crisis, though deep structural transformation (SET = 0.82) provides economic insurance Rwanda lacks. Botswana (ADRI = 0.67): high sustainability.
Burundi — sharing nearly identical geography, colonial history, ethnic composition, and pre-conflict income — provides the closest comparison. Rwanda averaged 7.4% GDP growth (2000–2022) versus Burundi’s 2.4%, with the key difference being mode of conflict termination: decisive military victory versus negotiated settlement. Online Appendix D presents the full comparative analysis including Mozambique and Costa Rica counterfactuals. Online Appendix E examines seven boundary conditions — cases the framework was not designed to explain — including resource states, post-Soviet EU accession, and democratic underperformance.
9. Limitations and Conclusion
9.1 Limitations
Single-pass construction. ADRI has not undergone external replication. The out-of-sample exercises provide evidence of stability but are not equivalent to independent reproduction.
V-Dem proxy limitations. Singapore’s SI of 0.37 understates the reality of four PM transitions. Expert-coded data carry known biases.
Archigos coverage. Transitions through 2015 only. Post-Mugabe Zimbabwe, post-Bashir Sudan, and the Xi consolidation are not in the sample.
MENA scope condition. Concordance = 0.534, near chance levels. ADRI does not capture the clan-based, sect-based, or monarchy-specific dynamics governing succession in MENA.
Endogeneity of institutional investment. The framework explains consequences of institutional investment, not why some leaders invest and others do not.
Case selection bias. The detailed case studies (online appendix) were chosen to illustrate the framework’s insurance profiles. The quantitative analysis uses the full universe of transitions, addressing this concern for the statistical results but not the qualitative narratives.
Replication. All ADRI scores can be reconstructed mechanically from V-Dem v13, World Bank WDI, and Archigos 4.1 using the rules in Section 3.
Falsifiable prediction. Archigos 5.0 would provide genuine out-of-sample tests (post-Mugabe Zimbabwe, post-Bashir Sudan, Abiy’s Ethiopia). Rwanda’s succession provides the ultimate test: ADRI = 0.33 predicts a 40% probability of irregular successor exit (95% CI: 35–44%).
9.2 Conclusion
The results support the insurance interpretation over the engine interpretation. Among leaders who died in office, succession institutionalization predicts successor stability (6.7% vs. 44.8% irregular exit, Fisher p = 0.0009) while V-Dem polyarchy does not (p = 0.454). Full-sample Cox models are consistent (HR = 0.57, p $<$ 0.001, concordance = 0.802), and ADRI predicts growth protection at transitions (all insurance channels p $<$ 0.001). Twelve tests find no robust positive effect of ADRI on growth rates (matching p = 0.98). Institutions predict whether growth survives leadership transitions, not how fast it occurs.
The composite ADRI does not dominate V-Dem polyarchy — an expected result given that the composite’s FMQ component overlaps substantially with what polyarchy already measures. The decomposition, however, identifies the specific dimension — succession institutionalization — that captures information polyarchy does not: among autocracies, whether mechanisms exist for selecting the next leader. SI predicts regime survival beyond what competitive elections capture (HR/SD = 0.72, p $<$ 0.001, controlling for polyarchy). The paper’s contribution is this decomposition, not the composite score.
The insurance-engine distinction resolves a tension at the center of the institutions literature. Acemoglu and Robinson (2012) predict that extractive institutions will fail to sustain growth, yet Singapore, South Korea, and Vietnam have sustained decades of growth under extractive political institutions. The resolution is that Acemoglu and Robinson are right about the endpoint — institutions determine long-run outcomes — but the mechanism is not that extractive institutions cause slow growth. They cause fragile growth. The binding constraint is not initiating development but sustaining it through leadership transitions. Growth under autocracy is common (29.3% of country-decades). Growth that survives the founder is rare. The question for any developing autocracy is not “how fast can we grow?” but “what happens when the leader departs?”
Three implications follow. First, the SI finding reorients the institutional design literature. The dominant framework classifies institutions as inclusive or extractive — a binary that predicts long-run convergence but not the timing of failure. SI identifies a specific, measurable institutional feature — whether a rule-governed process exists for leadership succession — that predicts failure timing within the extractive category. This suggests that the variation within extractive institutions is at least as consequential for development outcomes as the variation between extractive and inclusive ones, and that institutional reform efforts in autocracies should prioritize succession mechanisms over the broader democratization agenda that polyarchy captures.
Second, the insurance framework has implications for development policy. If institutions do not cause growth but determine whether growth survives, then the standard policy question — “what institutional reforms will accelerate development?” — is misspecified. The relevant question is: “what institutional investments will protect the development already achieved?” For aid donors and multilateral institutions, this implies that conditionality focused on growth outcomes misses the binding constraint. The 40% of Rwanda’s budget that comes from foreign aid has funded three decades of genuine development — but has not funded the institutional insurance that determines whether those gains survive the founder’s departure.
Third, the tenure-decay dynamic generates a structural prediction: the leaders who most need institutional insurance are those least likely to build it. Institutional quality declines with tenure in personalist regimes (−0.0052 ADRI points per year in closed autocracies), meaning that the succession crisis arrives precisely when institutional defenses are weakest. This is not a policy failure amenable to better advice — it is a structural feature of personalist rule that the formal model’s comparative statics predict will be selected against. Only exogenous shocks (Chile’s plebiscite), external anchors (EU conditionality), or the rare leader willing to constrain his own power (Lee Kuan Yew, Seretse Khama) break the cycle.
Rwanda’s institutional profile (ADRI = 0.33, SI = 0.19) generates a specific, falsifiable prediction: absent institutional deepening, a 40% probability of irregular successor exit (95% CI: 35–44%). Ethiopia’s trajectory — from sustained growth to civil war within six years of the founder’s death — illustrates the risk. The prediction will be tested by Rwanda’s eventual succession.
This appendix is organized as follows. Appendix A provides the full formal model and derivations. Appendix B reports additional empirical results, including IV estimates, event study coefficients, mediation analysis, the measurement channel, extended robustness checks, and heterogeneity analysis. Appendix C presents analytical summaries of six case studies (Singapore, South Korea, Ethiopia, Vietnam, China, Botswana) with ADRI scoring and diagnostic lessons. Appendix D provides comparative ADRI scores and cross-case analysis, including the Rwanda comparative counterfactuals. Appendix E examines seven boundary conditions and stress-test cases. Appendix F analyzes the aid-state capacity relationship.
A. Formal Model and Derivations
This appendix provides the full formal model summarized in Section 2.3 of the main paper, including derivations and extensions.
Setup
Consider a leader at time $t = 0$ who allocates a fixed per-period budget $B$ between visible outputs $v_t$ (infrastructure, health systems, business rankings) and institutional investments $i_t$ (independent judiciary, succession mechanisms, constitutional constraints), subject to $v_t + i_t = B$. Visible outputs generate immediate flow utility $\alpha v_t$. Institutional investments generate flow $\beta i_t$ beginning at $t + k$ (maturity lag), accruing to whoever holds power — which may not be the current leader.
Let $\lambda(t)$ denote the instantaneous hazard rate. The leader captures institutional returns only with probability $S(t,k) = \exp(-\int_t^{t+k} \lambda(s)\,ds)$. With pure time preference $\rho$, the interior solution requires:
\[\frac{\beta \cdot e^{-\lambda k}}{\rho + \lambda} \geq \alpha\]The left-hand side is strictly decreasing in $\lambda$: as the hazard rate rises, institutional investment becomes less attractive.
Comparative Static 1: Allocation
Claim. $\partial i^\ast/\partial \lambda < 0$. Higher hazard rates produce lower institutional investment.
Derivation. Differentiating the left-hand side with respect to $\lambda$:
\[\frac{\partial}{\partial \lambda}\left[\frac{\beta e^{-\lambda k}}{\rho + \lambda}\right] = \beta \cdot \frac{-k e^{-\lambda k}(\rho + \lambda) - e^{-\lambda k}}{(\rho + \lambda)^2} = \frac{-\beta e^{-\lambda k}[k(\rho + \lambda) + 1]}{(\rho + \lambda)^2} < 0\]since all terms in brackets are positive. The expected return to institutional investment is strictly decreasing in the hazard rate. At the interior solution, a marginal increase in $\lambda$ reduces $i^\ast$ proportionally.
Comparative Static 2: Tenure-Decay
In personalist regimes, the hazard rate is endogenous: $d\lambda/dt = -\phi(i_t) + \psi(t)$, where $\phi(i_t)$ captures institutional investment’s hazard-reducing effect ($\phi’ > 0$, $\phi(0) = 0$) and $\psi(t)$ captures the natural increase in hazard with tenure ($\psi > 0$, reflecting elite fatigue, succession uncertainty, and health deterioration).
When $i_t \approx 0$, $d\lambda/dt = \psi(t) > 0$: the hazard rate rises monotonically. Combined with Comparative Static 1, this produces a vicious cycle: low institutional investment $\to$ rising hazard $\to$ further reduction in institutional investment. This is the lifecycle trajectory documented by Geddes et al. (2018), who find that personalist regimes have a median duration of $\sim$15 years with 50% breakdown probability by year 20.
Comparative Static 3: Two Equilibria
Define $\bar{\lambda}$ as the hazard rate satisfying $\beta e^{-\bar{\lambda} k}/(\rho + \bar{\lambda}) = \alpha$ — the threshold above which the expected return to institutional investment falls below the return to visible outputs. Once $\lambda > \bar{\lambda}$, the leader optimally sets $i^\ast = 0$, which (by Comparative Static 2) ensures $\lambda$ continues to rise. The system has two stable states:
-
High-institutionalization equilibrium ($\lambda < \bar{\lambda}$): Institutional investment reduces the hazard, maintaining the incentive to invest. Self-reinforcing. Example: Singapore.
-
Low-institutionalization trap ($\lambda > \bar{\lambda}$): No institutional investment, rising hazard, further disincentive. Self-reinforcing. Examples: Rwanda (ADRI = 0.33, SI = 0.19), Ethiopia under Meles (ADRI = 0.27).
The transition from equilibrium 1 to equilibrium 2 can occur through exogenous shocks (coups, crises) that raise $\lambda$ above $\bar{\lambda}$, or through the leader’s failure to invest in institutions during the early tenure period when $\lambda$ is still low enough for investment to pay off.
Parameter Sensitivity
The threshold $\bar{\lambda}$ depends on three parameters: $\beta/\alpha$ (relative value of institutional vs. visible payoffs), $k$ (maturity lag), and $\rho$ (pure time preference).
If $\alpha = \beta$, institutional investment fails whenever $e^{-\lambda k}/(\rho + \lambda) < 1$, which holds for any $\lambda > 0$ when $k > 0$. That some autocrats invest (Singapore, pre-Xi China) implies $\beta > \alpha$: institutional payoffs must exceed visible-output payoffs per unit, reflecting the compounding nature of institutional returns.
The maturity lag $k$ is the key sensitivity parameter: at $k = 5$ years, a leader with median autocratic hazard ($\lambda = 0.05$) faces $e^{-0.25} = 0.78$ — 78% of nominal value retained. At $k = 15$ years, $e^{-0.75} = 0.47$ — more than half discounted away. This explains the empirically observed pattern: autocrats invest in fast-maturing institutions (anti-corruption agencies, economic planning boards) before slow-maturing ones (judicial independence, press freedom). Rwanda’s investment profile is consistent: SETR (0.55) and CSI (0.32) exceed FMQ (0.21) and SI (0.19).
Structural Transformation Extension
Structural transformation ($\tau$) enters through a separate channel, determining post-transition growth depreciation: $g_{\text{post}} = g_{\text{pre}} \cdot (1 - \delta_g(1-\tau))$. When $\tau = 1$ (complete transformation), growth survives regardless of political instability; when $\tau = 0$, growth is entirely dependent on political continuity. GDP measurement error $\mu$ is decreasing in feedback mechanism quality (FMQ), creating attenuation bias in reported-GDP regressions.
B. Additional Empirical Results
This appendix reports empirical results referenced but not displayed in the main paper.
B.1 IV Estimates
| Specification | $\beta$(ADRI) | SE | p | N |
|---|---|---|---|---|
| OLS (LPM) | −0.919 | 0.080 | $<$0.001 | 1,439 |
| IV: Regional ADRI | −2.511 | 0.344 | $<$0.001 | 1,439 |
| IV + regional GDP control | −0.887 | 0.300 | 0.004 | 1,439 |
| IV + own ln(GDP) control | −1.531 | 0.318 | $<$0.001 | 1,439 |
IV Estimates — ADRI and Political Stability (Irregular Exit, LPM)
Anderson-Rubin weak-IV-robust 95% CIs: irregular exit [−1.32, −1.06], $\lvert growth change \rvert$ [−3.60, 0.02]. Hausman test rejects OLS consistency for both outcomes (p $<$ 0.001). The direction of IV correction — 2SLS nearly three times larger than OLS — is consistent with measurement error attenuation in V-Dem proxies.
Two supplementary instruments produce qualitatively consistent results. A colonial origin IV (10 categories following La Porta et al. 1998; AJR 2001) captures historically determined institutional inheritance. A Bartik shift-share IV (first-stage F = 104.8) interacts initial ADRI with subsequent global institutional trends.
B.2 Event Study Coefficients
| Event time | $\beta$ | SE | p | N |
|---|---|---|---|---|
| t−5 | −1.20 | 1.31 | 0.15 | 1,324 |
| t−4 | −0.73 | 1.15 | 0.22 | 1,353 |
| t−3 | −1.60 | 1.14 | 0.05 | 1,383 |
| t−2 | −1.98 | 1.16 | 0.02 | 1,425 |
| t−1 | 0.00 | — | — | 1,459 |
| t = 0 | 2.86 | 1.04 | 0.03 | 1,459 |
| t+1 | −2.20 | 1.34 | 0.03 | 1,459 |
| t+2 | −1.52 | 1.06 | 0.04 | 1,459 |
| t+3 | −1.23 | 1.09 | 0.08 | 1,459 |
| t+4 | −2.23 | 0.99 | 0.003 | 1,459 |
| t+5 | −3.53 | 0.86 | $<$0.001 | 1,459 |
Event Study Coefficients (Continuous ADRI, Normalized to t−1)
Pre-trends: joint F = 0.33, p = 0.89. Two individual pre-period coefficients reach marginal significance (t−3: p = 0.05; t−2: p = 0.02), but the joint test — the appropriate criterion given multiplicity (Roth (2023)) — is strongly null. The negative sign on both implies any pre-existing differential biases against our result: the estimated insurance effect is, if anything, attenuated.
B.3 Imputation Event Study Coefficients
| Event time | ATT | SE | p |
|---|---|---|---|
| t−3 | −0.37 | 1.14 | 0.747 |
| t−2 | 1.23 | 1.04 | 0.238 |
| t−1 | −1.64 | 0.56 | 0.003 |
| t = 0 | −3.68 | 0.92 | $<$0.001 |
| t+1 | −2.66 | 0.90 | 0.003 |
| t+2 | −2.44 | 0.73 | $<$0.001 |
| t+3 | −0.88 | 0.91 | 0.330 |
| t+4 | −0.86 | 0.92 | 0.348 |
| t+5 | −0.51 | 0.62 | 0.411 |
BJS Imputation Event Study — Effect of Irregular Transition on GDP Growth
Pre-trends: Wald test $\chi$$^2$(5) = 6.60, p = 0.25. The t−1 coefficient is individually significant (p = 0.003), likely reflecting anticipation: political instability is often visible in the year before a formal irregular exit, producing measurable economic deterioration before the transition event. This is consistent with the insurance mechanism — actors respond to succession uncertainty before the crisis materializes — and biases against our result if anything, since it implies the “treatment” partially begins before t = 0. Redefining treatment onset at t−1 (incorporating anticipation) yields a larger ATT, confirming that the baseline specification is conservative. N = 81 treated countries, 93 never-treated.
B.4 Mediation Analysis
We test whether ADRI’s growth protection operates through regime stability using the Baron-Kenny framework. When irregular exit is included alongside ADRI in predicting $\lvert growth change \rvert$, ADRI retains its full significance ($\beta$ = −3.82, p $<$ 0.001) while irregular exit is small and insignificant ($\beta$ = −0.12, p = 0.55). The Sobel test is null (z = 0.52, p = 0.61), with only 5% of the total effect mediated through irregular exit alone. In a kitchen-sink mediation with all channel variables (N = 305), the direct ADRI effect remains significant ($\beta$ = −3.90, p $<$ 0.001), with all observable channels combined explaining only 8.4% of the total effect (the figure reported in the main paper). The remaining 91.6% operates through unmeasured channels — possibly policy continuity, investor confidence, administrative capacity, or succession certainty. Several considerations bear on interpreting this large residual. Mediation decompositions require sequential ignorability (Imai et al. (2011)), an assumption unlikely to hold exactly with cross-country observational data; measurement error in the mediators further attenuates estimated indirect effects. The small mediated share through irregular exit should not be read as evidence that transition type is irrelevant, but rather that ADRI’s growth-protective effect is over-determined — it operates through many channels simultaneously, no single one of which accounts for the majority of the effect. Developing micro-level mediators (e.g., firm-level investment responses to succession events, bureaucratic turnover rates, sovereign risk premia around transitions) that can isolate these channels is a natural next step.
B.5 Counterfactual GDP Trajectories
High-ADRI and low-ADRI autocracies crash at virtually identical rates (7.0% vs. 7.2% of years, p = 0.82). Monte Carlo simulation indicates the 0.2pp crash-rate differential produces only a 1% GDP gap over 30 years. The compound interest mechanism is not supported.
B.6 Measurement Channel
| Variable | $\beta$ | SE | p |
|---|---|---|---|
| FMQ | −13.065 | 2.005 | $<$0.001 |
| Autocracy | −8.413 | 1.597 | $<$0.001 |
| FMQ $\times$ Autocracy | 11.127 | 2.254 | $<$0.001 |
| ln(GDP) | 0.608 | 0.144 | $<$0.001 |
Growth Reporting Gap Analysis. N = 1,459. R$^2$ = 0.043.
The positive FMQ $\times$ Autocracy interaction is consistent with the measurement prediction: among autocracies, higher FMQ is associated with more conservative GDP reporting — low-FMQ autocracies show systematically larger gaps between reported growth and structural fundamentals (Martinez (2022)). Among liberal democracies (where GDP data is constrained by independent statistical agencies), ADRI predicts growth ($\beta$ = 10.80, p $<$ 0.001). Among autocracies, the coefficient vanishes. Higher-ADRI autocracies report conservatively ($\beta$ = −2.25, p = 0.038).
B.7 Regional and Subsample Heterogeneity
The insurance effect holds across all six World Bank regions: Sub-Saharan Africa ($\beta$ = −11.02, p $<$ 0.001), Latin America ($\beta$ = −8.38, p $<$ 0.001), East Asia ($\beta$ = −10.75, p $<$ 0.001), South Asia ($\beta$ = −9.04, p = 0.004), MENA ($\beta$ = −4.11, p = 0.012), Europe & Central Asia ($\beta$ = −10.24, p $<$ 0.001). The effect holds across all income terciles (all p $<$ 0.001). Among closed autocracies (48% irregular exit rate), ADRI logit $\beta$ = −4.45 (p = 0.003); among electoral autocracies (28%), $\beta$ = −5.79 (p $<$ 0.001); among electoral democracies, null (p = 0.60) — institutional quality matters less when institutionalized exit mechanisms already exist.
The stability result is robust across subsamples: significant in 5 of 7 world regions, all income terciles, and every decade from the 1960s through 2010s. The $\lvert growth change \rvert$ result shows more heterogeneity: significant in 4 of 7 regions, the high-income tercile only, and concentrated in 1960–1980. MENA is a scope condition (concordance = 0.534).
B.8 Extended Robustness Battery
Wild cluster bootstrap. All transition-level results survive: $\lvert growth change \rvert$ WCB p $<$ 0.001, P(irregular exit) WCB p $<$ 0.001, P(crash) WCB p $<$ 0.001.
Two-way clustering. SEs for $\lvert growth change \rvert$ decrease with two-way clustering by country and decade (SE ratio = 0.70). P(irregular exit) SEs virtually unchanged (ratio = 0.93).
E-values. For multivariate Cox (HR = 0.57): E-value = 2.9.
CHR bounds (Conley, Hansen, and Rossi 2012). Relaxing the IV exclusion restriction:
| Outcome | $\gamma$ = 0 | $\gamma$ = $\pm$0.5$\times$SE | $\gamma$ = $\pm$1.0$\times$SE | $\gamma$ = $\pm$2.0$\times$SE | Excludes 0? |
|---|---|---|---|---|---|
| P(irregular exit) | [−1.33, −1.05] | [−1.36, −1.01] | [−1.40, −0.98] | [−1.48, −0.90] | Yes at all |
| $\lvert$Growth change$\rvert$ | [−3.63, 0.02] | [−4.10, 0.49] | [−4.56, 0.97] | [−5.50, 1.92] | No |
The stability CI excludes zero at $\gamma$ = $\pm$2 SD while the growth-change CI does not.
Multiple hypothesis correction. Romano-Wolf stepdown: 6/7 insurance outcomes survive at family-wise p $<$ 0.05. Only signed growth change fails (RW p = 0.36).
GWF regime type. ADRI adds 0.027 concordance over regime type alone (0.801 vs. 0.774). ADRI significant (p $<$ 0.001) controlling for regime type.
Glaeser et al. controls. P(irregular exit): ADRI survives kitchen sink with ln(GDP), ln(population), electoral democracy, rule of law, and full institutional battery ($\beta$ = −0.70, p $<$ 0.001, N = 687).
Generated regressor. Cluster bootstrap SE inflation: 1.01$\times$ for $\lvert growth change \rvert$, 1.14$\times$ for P(irregular exit). Negligible.
Falsification. Predetermined placebos (odd/even year, leap year, first letter of leader name, country name length) all null. ADRI predicts several quasi-predetermined outcomes but adding all as controls, $\lvert growth change \rvert$ remains significant ($\beta$ = −4.60, p = 0.005).
Temporal falsification / reverse causality. For regime stability, delta_ADRI is null at k = 5 (p = 0.23) and k = 10 (p = 0.12). ADRI is highly persistent (lag-1 r = 0.99, lag-5 r = 0.94, lag-10 r = 0.89).
Out-of-sample. 10-fold CV (200 folds): mean test concordance = 0.799 (SD = 0.040). Temporal hold-out (train pre-2000, test post-2000): concordance = 0.792. Geographic hold-out: mean = 0.745, range 0.534 (MENA) to 0.902 (Europe & Central Asia).
Benjamini-Hochberg FDR. 6/7 outcomes survive at q $<$ 0.05. Only signed growth change fails (q = 0.109).
Personalist penalty. Both ADRI and closed-autocracy dummy significant jointly (ADRI: $\beta$ = 3.029, p $<$ 0.001; personalist: $\beta$ = 1.297, p $<$ 0.001). ADRI captures information beyond the GWF personalist/institutional distinction.
Cross-domain construct validation. World Bank GDP outcomes are independent of V-Dem/Archigos construction data.
C. Case Studies
C.1 Introduction
The companion paper establishes that institutional quality, measured by the Authoritarian Development Resilience Index (ADRI), powerfully predicts whether autocratic growth survives the founding leader’s departure (multivariate Cox HR = 0.57 per SD, p $<$ 0.001, concordance = 0.802). The mechanism is insurance, not engine: institutions determine whether growth survives leadership transitions, not how fast it occurs during the founder’s tenure. The following case studies provide the qualitative evidence underlying this framework.
Singapore (Section C.2) demonstrates maximum insurance: ADRI of 0.65, four successive leadership transitions, 176-fold GDP per capita increase. South Korea (Section C.3) demonstrates transformation as insurance, where structural economic depth compensated for the total absence of succession mechanisms. Ethiopia (Section C.4) provides the most devastating evidence for personalist developmental authoritarianism, descending from “African miracle” to civil war within six years of the founder’s death. Vietnam (Section C.5) illustrates collective authoritarianism as insurance, with eight General Secretary transitions since 1960. China (Section C.6) demonstrates institutional fragility, as Deng Xiaoping’s carefully engineered constraints were systematically dismantled by Xi Jinping. Botswana (Section C.7) represents the democratic counterfactual. Stress tests (Appendix E) examine seven additional cases: Taiwan, India, Tanzania, Chile, Japan, Gulf states, and post-Soviet states.
Methodological note on case selection
By institutional type. Democratic: Botswana, India. Institutional authoritarian: Singapore, Taiwan. Transformation-driven: South Korea. Collective authoritarian: Vietnam, China (pre-Xi), Ethiopia (pre-2001). Personalist: Rwanda, Ethiopia (post-2001), China (under Xi), Chile (under Pinochet).
By outcome. Sustained success: Singapore, South Korea, Botswana, Taiwan. Moderate success with ongoing risk: Vietnam, China. Collapse: Ethiopia. Untested: Rwanda. Democratic underperformance: India, Tanzania. Personalist to democratic transition: Chile.
By ADRI level. The cases span from Ethiopia (0.27) through Rwanda (0.33), Vietnam (0.41), China (0.42), Singapore (0.65), and Botswana (0.67) to post-democratization South Korea (0.81). Regional diversity — East Asia, Sub-Saharan Africa, Latin America, the Middle East, South Asia — tests whether institutional mechanisms identified in East Asian contexts operate similarly under the different colonial legacies, ethnic fragmentation, and aid dependence that characterize African development.
C.2 Singapore: Maximum Insurance (ADRI = 0.65)
At independence in 1965, Singapore had GDP per capita of \$516, no natural resources, 14% unemployment, and water imported from Malaysia. British colonialism, unlike Belgian colonialism in Rwanda, had built institutional assets — English common law, meritocratic civil service traditions, a functioning port — that Lee Kuan Yew chose to deepen rather than dismantle (Lee (2000)). The Economic Development Board (EDB, 1961) executed six phases of staged industrialization: labor-intensive manufacturing (1965–1979), forced upgrading to precision engineering (1979–1985), crisis-response restructuring (1985–1987), financial and biomedical diversification (1990s–2000s), and innovation economy (2010s–present). GDP per capita reached \$82,808 by 2022 — a 160-fold increase.
The institutional infrastructure is distinctive: Temasek Holdings (S\$354M to S\$434B, publicly reported), the CPIB (anti-corruption), HDB (80% home ownership creating stakeholder citizenry), and “calibrated responsiveness” through genuine vote fluctuations (60–84%). The PAP cadre system — “the cardinals appoint the pope and the pope appoints the cardinals” — produced four orderly PM transitions, including one (1990) that overrode the founder’s preference.
Note on scoring discrepancy: This qualitative assessment scores Singapore’s succession institutionalization at 1.0 based on observed outcomes (four successful PM transitions). The mechanical ADRI used in the main paper’s quantitative analysis scores Singapore’s SI at 0.37, reflecting V-Dem’s classification of Singapore as an electoral autocracy with limited party institutionalization. The discrepancy illustrates a proxy limitation acknowledged in the main paper: V-Dem coding understates Singapore’s functional succession capacity. All quantitative results use the mechanical V-Dem-based scores.
The Singapore-Rwanda comparison
The ADRI gap — Singapore at 0.65, Rwanda at 0.33 — reflects specific, measurable differences on each dimension. Succession: Singapore has four PM transitions and a party cadre system; Rwanda has zero transitions and no visible succession mechanism. Transformation: Singapore executed six phases of staged industrialization (\$516 to \$82,808); Rwanda’s growth (\$132 to \$1,000) is from a post-genocide base with limited manufacturing and $\sim$40% aid dependence. Feedback: Singapore’s vote fluctuations (60–84%) carry real information; Rwanda’s RPF wins exceed 98%. Transparency: Temasek publishes annual results with independent governance; Crystal Ventures is party-owned with no public reporting. Civil service: Singapore’s PSC operates independently of individual PMs; Rwanda’s bureaucratic quality depends on Kagame’s personal oversight.
Singapore’s institutional insurance means a leadership transition threatens continuity on no dimension. Rwanda’s institutional deficit means a transition threatens continuity on every dimension. Singapore is not the model to emulate — it is the diagnostic standard against which other cases should be measured.
C.3 South Korea: Transformation as Insurance (ADRI: 0.41 -$>$ 0.81)
When Park Chung-hee seized power in 1961, South Korea’s GDP per capita was \$82 — lower than most of sub-Saharan Africa. Japanese colonialism had built centralized bureaucratic capacity and the organizational template Park replicated as the chaebol system (Kohli (2004)). The Economic Planning Board (EPB, 1961) combined planning, budgeting, and foreign capital management with genuine meritocratic autonomy. State-directed credit allocation (kwanchi kumyung) linked cheap credit to export targets enforced through monthly presidential meetings (Amsden (1989)). The Heavy and Chemical Industry drive (1973–1979) built POSCO, Hyundai, and Samsung into globally competitive firms. By Park’s assassination in 1979, manufacturing had risen from 14% to 30% of GDP and exports from \$41M to \$15B.
Park built no succession mechanism and was assassinated by his own intelligence chief. Yet the economy continued to grow — the central data point for the insurance framework. EPB-KDI economists bridged the transition; average growth was 9.2% annually (1982–1987). By 1987, structural transformation had created a middle class that demanded and won democratic elections. GDP per capita reached \$32,000 by 2022.
Diagnostic lesson
South Korea proves that structural transformation can compensate for institutional deficit — but only if transformation is deep enough to create autonomous economic actors. The economy survived Park’s assassination because Samsung, Hyundai, and POSCO had their own institutional momentum independent of political leadership. Rwanda at \$1,000 per capita, with 43% of the labor force in agriculture and no globally competitive indigenous firms, has not created comparable structural conditions. South Korea at \$1,000 per capita (1979) had already built POSCO, Hyundai Heavy Industries, and Samsung Semiconductor. Structural transformation eventually generated its own succession mechanism — a middle class that demanded democracy — but only after two decades of post-assassination turbulence including a massacre and the sustained mobilization of millions.
C.4 Ethiopia: From Developmental State to Collapse (ADRI = 0.27)
Ethiopia under Meles Zenawi (1991–2012) provides the most direct empirical test of the framework’s prediction for personalist developmental authoritarianism. The EPRDF maintained genuine Leninist organizational architecture — Politburo, Central Committee, one-to-five cellular organization enrolling five million members (Clapham (2018); Vaughan and Tronvoll (2003)) — yet this infrastructure proved insufficient to survive the founder’s departure. GDP growth averaged $\sim$10.4% annually (2004–2015), but agriculture still employed over 70% of the labor force and manufacturing remained below 5% of GDP (Jerven (2013); Oqubay (2015)). Party-affiliated conglomerates (EFFORT, TIRET, TUMSA) operated without public audit (Vaughan and Gebremichael (2011)).
The 2001 TPLF split was the pivotal institutional moment: Meles purged senior founders who demanded collective leadership, converting the EPRDF from a constraint on his authority into an instrument of it. Meles died on August 20, 2012. Successor Hailemariam Desalegn could lead no faction; successor Abiy Ahmed dissolved the EPRDF entirely (2019). The Tigray War (2020–2022) produced an estimated 300,000–600,000 deaths. The system collapsed within six years of the founder’s death.
Note on scoring discrepancy: This qualitative assessment scores Ethiopia at 0.15; the mechanical ADRI used in the main paper’s quantitative analysis scores Ethiopia at 0.27. The difference arises because V-Dem assigns Ethiopia non-zero values on party institutionalization (the EPRDF’s Leninist infrastructure) and structural transformation sub-indicators that this qualitative assessment rounds to zero. All quantitative results use the mechanical V-Dem-based scores.
Ethiopia scored zero on every institutional component except civil service competence — the one that depends least on independent institutional architecture. The system collapsed not because institutions were too weak to sustain themselves, but because a successor (Abiy) actively chose to destroy them. Matfess (2015) explicitly pairs them: “Rwanda and Ethiopia: Developmental Authoritarianism and the New Politics of African Strong Men.” Ethiopia after Meles is the counterfactual for Rwanda after Kagame.
C.5 Vietnam: Collective Authoritarianism as Insurance (ADRI = 0.41)
The Doi Moi revolution: reform from within
Vietnam’s post-reunification trajectory demonstrates how collective authoritarian institutions generate developmental resilience that personalist systems cannot replicate. After reunification in 1975, centralized planning drove GDP per capita to approximately \$83 by the mid-1980s, with inflation exceeding 700% in 1986. Unlike China’s Deng-driven opening, Doi Moi (“Renovation”) emerged through a genuinely collective process: local “fence-breaking” (pha rao) experiments in southern provinces demonstrated market mechanisms’ effectiveness, and the Sixth National Congress in December 1986 elected reformist Nguyen Van Linh—previously purged for supporting those experiments—ratifying the bottom-up reforms as national policy without public rupture or crisis.
The reform sequence: gradualism as institutional discipline
The reforms unfolded in a carefully sequenced progression. Agricultural decollectivization (1988–1993) transformed Vietnam from a rice importer to the world’s second- or third-largest exporter within three years. Price liberalization in 1989 brought inflation from over 300% to single digits by the mid-1990s. The Foreign Investment Law of 1987 was progressively liberalized, with Vietnam joining ASEAN (1995), signing the U.S. bilateral trade agreement (2000), and acceding to the WTO (2007)—each step locking in reforms through international commitments. SOE numbers were reduced from approximately 12,000 to 3,000 by 2010 through gradual equitization, avoiding the mass disruption of post-Soviet rapid privatization.
The cumulative results constitute one of the most impressive developmental transformations of the late twentieth century: GDP per capita rose from \$83 in 1986 to approximately \$4,100 by 2022, poverty fell from over 70% to under 5% by 2020, and manufacturing rose to approximately 24% of GDP. Total exports surged from \$2.4 billion in 1990 to over \$370 billion by 2022. The FDI-driven model produced rapid employment creation and export growth but limited technology transfer—Vietnamese domestic firms remained largely confined to low-value supply chain segments.
Collective leadership: the institutional architecture
Vietnam’s critical institutional feature is its system of collective leadership, with power distributed among four pillars: the General Secretary, the President, the Prime Minister, and the Chairman of the National Assembly. No single individual held more than one position simultaneously—a norm that has been consistently maintained. The Central Committee of the CPV (approximately 180 full members) exercises genuine authority over the Politburo. In 2001, the Central Committee rejected the Politburo’s recommendation for General Secretary—an event with no parallel in China, where the PBSC’s decisions are never publicly challenged. This demonstrated that Vietnam’s collective constraints had practical force, not merely nominal authority.
Eight transitions: the empirical record
Since Ho Chi Minh’s death in 1969, Vietnam has navigated seven General Secretary transitions—each orderly, each accomplished without economic disruption. Key transitions include: Le Duan’s death opening the reform window (1986); the Sixth Congress electing reformist Nguyen Van Linh through formal party mechanisms; the 2001 Central Committee override of the Politburo’s recommendation (the strongest evidence of genuine collective authoritarianism); and Nguyen Phu Trong’s anti-corruption campaign operating within (rather than against) the collective framework (2011–present).
The ADRI assessment
Vietnam’s ADRI score of 0.41 reflects a mixed institutional profile: genuine collective leadership and meaningful structural transformation offset by weak feedback mechanisms, limited state capitalism transparency, and civil service quality that remains dependent on party discipline rather than independent institutions. The score places Vietnam above Ethiopia (0.27) and Rwanda (0.33) but well below Singapore (0.65) and post-democratization South Korea (0.81). The critical variable is succession institutionalization, where Vietnam scores meaningfully above zero — unlike Ethiopia, China under Xi, or Rwanda — reflecting the eight transitions and the Central Committee’s demonstrated independence. Whether this institutional asset can be maintained will determine whether Vietnam preserves collective leadership or slides toward personalist consolidation.
C.6 China: Insurance Dismantled (ADRI declining)
Deng Xiaoping’s institutional engineering
China provides the insurance framework’s most dramatic illustration that authoritarian institutional constraints have no independent enforcement mechanism. Deng Xiaoping’s August 1980 speech diagnosed the Mao era’s pathologies—“over-concentration of power,” “patriarchal methods,” “life tenure in leading posts”—and established specific constraints to prevent their recurrence: constitutional two-term presidential limits (1982 Constitution, Article 79); the “seven up, eight down” age-based retirement norm enforced across three successive congresses; collective leadership of the Politburo Standing Committee, with the General Secretary as first among equals; separation of party and state functions; and institutionalized consultation through regularized Central Committee plenums.
The results: growth across transitions
Under the reform era (1978–2012), China achieved GDP per capita growth from approximately \$200 to \$10,000, lifting over 800 million people from extreme poverty—approximately three-quarters of all global poverty reduction during this period. Annual GDP growth averaged approximately 10% across three decades. The system sustained growth across two orderly leadership transitions: Deng to Jiang Zemin (1989/1992) and Jiang to Hu Jintao (2002), each accompanied by generational turnover. The Jiang era delivered WTO accession and SOE reform; the Hu-Wen era managed the 2008 financial crisis with growth never falling below 6.1%. Throughout both eras, term limits were observed, retirement norms followed, and collective leadership maintained. The system’s ADRI was approximately 0.43—moderate, reflecting genuine structural transformation (SET = 0.84) but constrained by absent feedback mechanisms (FMQ = 0.07).
Xi Jinping’s dismantlement
Xi Jinping’s systematic destruction of Deng’s architecture, beginning in November 2012, dismantled every major constraint within five years: term limits abolished (NPC voted 2,958 to 2 in March 2018); age-based retirement norms destroyed (Xi began an unprecedented third term at age 69 at the 20th Congress); collective leadership replaced by personal authority (all seven 20th Congress PBSC members were Xi loyalists with no independent power base; Li Qiang became Premier despite no central government experience); personnel control captured through the Organization Department; “Xi Jinping Thought” enshrined in party and national constitutions—a status only Mao achieved during his lifetime; and anti-corruption campaigns disciplining an estimated 6.27 million party members, with targets disproportionately concentrated among factional rivals.
The structural lesson
The lesson is structural: authoritarian institutional constraints have no independent enforcement mechanism. In a democracy, term limits are enforced by independent courts, legislatures with their own power base, a free press, and an electorate. China’s norms had none of these enforcers. The comparison with Vietnam’s 2001 Central Committee vote is instructive—Vietnam’s Central Committee overrode the Politburo; China’s never has. Deng could build constraints; he could not build constraints on constraints. The problem is logically irreducible within authoritarianism: rules binding future leaders require enforcers independent of those leaders, but independent power centers are precisely what authoritarianism prohibits. Only independent courts, legislatures, free media, and opposition parties can enforce rules on leaders who wish to break them—and these are the defining features of the democratic systems that authoritarian developmental states reject.
Economic consequences: the TFP collapse
China’s trajectory under Xi confirms the framework’s prediction. Official GDP growth decelerated from approximately 10% to roughly 5% (2013–2022). Total factor productivity growth collapsed from approximately 3.5% annually in the 2000s to roughly 0.7% in the 2010s—coinciding precisely with Xi’s concentration of authority. The technology sector crackdowns beginning in late 2020 (Ant Group IPO cancellation, Alibaba’s \$2.8 billion fine, destruction of the private tutoring industry) destroyed over \$2 trillion in market capitalization.
The ADRI trajectory
China’s ADRI has declined from approximately 0.43 during the Hu era to 0.42 or below under Xi — a modest numerical decline that understates the qualitative institutional regression. The succession institutionalization component, which had been one of China’s genuine institutional assets, has collapsed to near zero: there is no visible succession mechanism, no designated successor, and no institutional process independent of Xi’s personal authority. The trajectory is from collective authoritarian development to personalist authoritarianism — the same trajectory the framework identifies for Ethiopia under Abiy and predicts for Rwanda.
C.7 Botswana: The Democratic Counterfactual (ADRI = 0.67)
The Tswana inheritance: pre-colonial institutions as developmental asset
Botswana represents democratic development working as Acemoglu and Robinson (2012)’s Why Nations Fail (2012) predicts—inclusive institutions producing sustained development. It achieved approximately 9% annual growth from independence in 1966 through the mid-1990s under democratic governance, rising from GDP per capita of approximately \$70 to roughly \$7,500 by 2022. The foundation was the Tswana kgotla system—a public assembly at which the chief was required to consult with subjects, with an exit option (relocation to rival polities) functioning as an accountability mechanism. British colonial “constructive neglect” in Bechuanaland preserved these institutions, whereas Belgian colonialism in Rwanda dismantled indigenous governance and hardened fluid social categories into rigid ethnic identities.
Seretse Khama’s founding decisions
Three founding decisions by President Seretse Khama (1966–1980) were decisive. First, the 1967 Mines and Minerals Act nationalized mineral rights before commercially viable diamond deposits were discovered—a principled institutional choice that channeled subsequent diamond wealth to national development rather than tribal patronage. Second, Khama retained experienced British civil servants during the transition, ensuring continuity of state capacity (similar to Lee Kuan Yew’s approach in Singapore). Third, the government invested heavily in human capital despite starting with only 22 university graduates in the entire country, with education spending consistently at 20–25% of government expenditure.
Diamond management: the Debswana model
The Debswana Diamond Company, a 50-50 joint venture between Botswana and De Beers (1969), balanced state revenue extraction with professional management. Revenue accrued through equity participation, royalties, corporate taxes, and a 15% stake in De Beers itself (acquired 2011). The Sustainable Budget Index required mineral revenues fund investment rather than recurrent expenditure; the Pula Fund accumulated reserves for stabilization and intergenerational savings. Total diamond revenue since independence has exceeded \$50 billion. These institutional mechanisms—established before resource wealth created rent-seeking incentives—explain why Botswana avoided the resource curse that afflicted comparable economies.
Democratic governance: the institutional record
Since independence, Botswana has held regular multiparty elections every five years with universal suffrage, an independent electoral commission, a free press (by African standards), and an independent judiciary. Leadership successions from Khama through Masire, Mogae, Ian Khama, and Masisi were each constitutional and orderly—a record unmatched by any non-island African state.
Limitations and boundary conditions
Botswana’s case has important boundary conditions: diamond dependence (approximately 80% of export revenue) with limited diversification; a small population (2.7 million) facilitating consultative governance that may not scale; relative ethnic homogeneity compared to Ethiopia or Rwanda; persistent inequality (Gini approximately 0.53) with diamond wealth coexisting alongside youth unemployment exceeding 30%; and moderate structural economic transformation (SET = 0.44) reflecting capital-intensive extraction rather than broad-based manufacturing. The relevant question is not “why can’t you be Botswana?” but “given your starting conditions, which path offers the best trade-off between speed, sustainability, and human cost?”
The ADRI assessment
Botswana’s ADRI of 0.67 — the highest in this analysis — reflects its institutional strengths across multiple dimensions: high succession institutionalization (SI = 0.69, reflecting regular democratic transfers), high feedback mechanism quality (FMQ = 0.67, reflecting genuine multiparty democracy with real competition), high civil service independence (CSI = 0.71), but moderate structural economic transformation (SET = 0.44, reflecting diamond dependence and limited manufacturing). The ADRI profile demonstrates that institutional quality can compensate for limited structural transformation — the inverse of South Korea’s pattern, where deep transformation compensated for institutional deficit. Botswana’s institutional insurance protects against leadership failure; South Korea’s structural transformation provided insurance against political crisis. Both paths work, but through different mechanisms.
D. Comparative Analysis and Counterfactuals
D.1 Comparative ADRI Scores
| Component | Mean | SD | Median | IQR | Min | Max | Missing (%) |
|---|---|---|---|---|---|---|---|
| SI (Succession Institutionalization) | 0.40 | 0.24 | 0.36 | 0.21–0.58 | 0.00 | 0.95 | 2.1% |
| SET (Structural Economic Transformation) | 0.44 | 0.27 | 0.40 | 0.21–0.66 | 0.00 | 1.00 | 8.3% |
| FMQ (Feedback Mechanism Quality) | 0.40 | 0.28 | 0.34 | 0.14–0.65 | 0.01 | 0.92 | 1.8% |
| SETR (State Econ. Transparency and Rule of Law) | 0.46 | 0.23 | 0.43 | 0.28–0.63 | 0.02 | 0.99 | 5.7% |
| CSI (Civil Service Independence) | 0.41 | 0.25 | 0.37 | 0.20–0.60 | 0.01 | 0.94 | 3.2% |
| ADRI (composite) | 0.42 | 0.20 | 0.39 | 0.26–0.56 | 0.04 | 0.92 | 0.0% |
ADRI Component Descriptive Statistics (Full Panel, 10,908 country-years)
| Country | Year | Event | ADRI | SI | SET | FMQ | SETR | CSI |
|---|---|---|---|---|---|---|---|---|
| Singapore | 1965 | Independence | 0.29 | 0.15 | 0.18 | 0.30 | 0.52 | 0.30 |
| Singapore | 1990 | Lee to Goh | 0.53 | 0.31 | 0.68 | 0.34 | 0.85 | 0.64 |
| Singapore | 2024 | Lee HL to Wong | 0.65 | 0.37 | 0.79 | 0.37 | 0.97 | 0.73 |
| S. Korea | 1979 | Park assassination | 0.35 | 0.15 | 0.52 | 0.17 | 0.60 | 0.33 |
| S. Korea | 1988 | Post-democratization | 0.67 | 0.48 | 0.72 | 0.76 | 0.72 | 0.68 |
| S. Korea | 2020 | Current | 0.81 | 0.53 | 0.89 | 0.90 | 0.87 | 0.87 |
| Ethiopia | 2012 | Meles death | 0.27 | 0.32 | 0.18 | 0.26 | 0.39 | 0.19 |
| Rwanda | 2020 | Current | 0.33 | 0.19 | 0.37 | 0.21 | 0.55 | 0.32 |
| Vietnam | 2020 | Current | 0.41 | 0.38 | 0.75 | 0.17 | 0.46 | 0.31 |
| China | 2012 | Hu to Xi | 0.43 | 0.49 | 0.80 | 0.10 | 0.47 | 0.26 |
| China | 2020 | Xi consolidation | 0.42 | 0.49 | 0.82 | 0.07 | 0.47 | 0.24 |
| Botswana | 2020 | Current | 0.66 | 0.69 | 0.44 | 0.67 | 0.78 | 0.71 |
ADRI Trajectories for Primary Case Studies
Abbreviations. Type abbreviations: Inst. = institutional authoritarian; Trans. = transformation-driven (democratized); Dem. = democratic; Coll. = collective authoritarian; Pers. = personalist. ADRI is the composite Authoritarian Development Resilience Index, normalized to 0–1. SI = Succession Institutionalization; SET = Structural Economic Transformation; FMQ = Feedback Mechanism Quality; SETR = State Economic Transparency and Restraint; CSI = Civil Service Independence. The “Prediction” column indicates the framework’s ex ante assessment of developmental sustainability; the “Outcome” column records the observed result.
The data reveals a striking pattern: the three cases with the highest ADRI scores (South Korea post-democratization at 0.81, Botswana at 0.67, Singapore at 0.65) have all confirmed the framework’s prediction of sustained development through multiple leadership transitions. The two cases with the lowest ADRI scores (Ethiopia at 0.27, Rwanda at 0.33) have either confirmed the prediction of collapse (Ethiopia) or remain untested (Rwanda). The intermediate cases (Vietnam at 0.41, China at 0.42) are either holding precariously (Vietnam) or actively deteriorating (China under Xi). The correlation between ADRI level and developmental outcome is not perfect — the framework acknowledges stochastic variation and the role of contingency — but the directional relationship is consistent with the main paper’s quantitative findings.
The interaction between succession and transformation. South Korea’s case demonstrates that structural transformation can substitute for succession institutionalization — but only when transformation is deep enough to create autonomous economic actors. South Korea under Park scored zero on succession but 1.0 on transformation; the economy survived the assassination because Samsung, Hyundai, and POSCO had their own institutional momentum. Ethiopia under Meles scored zero on succession and only 0.25 on transformation — meaning neither institutional insurance nor structural insurance was available when the leader departed. The interaction effect is crucial: moderate scores on both dimensions may provide more resilience than a high score on one and zero on the other. Vietnam’s moderate scores on both succession (0.38) and transformation (0.75) may provide more real-world insurance than Ethiopia’s extreme asymmetry (0 on succession, 0.25 on transformation). The ADRI’s composite structure captures this interaction: total scores reflect the availability of multiple insurance mechanisms, not the depth of any single one.
Colonial inheritance shapes the ceiling for institutional insurance. Five of seven primary cases (Singapore, South Korea, Botswana, Vietnam, China) inherited functional state capacity from colonial or pre-revolutionary periods that could be redirected toward developmental purposes. The two that did not — Ethiopia and Rwanda — built administrative capacity through guerrilla warfare, producing organizations designed for hierarchical command rather than the distributed authority that institutional insurance requires. This pattern suggests that the institutional foundations of developmental success are often established before the developmental project begins, and that wartime-origin regimes face a structural disadvantage in building the self-binding mechanisms the framework identifies as essential.
D.2 The Overarching Lesson
The cases reveal a fundamental asymmetry in the relationship between institutions and development. Good institutions do not make autocracies grow faster — the twelve causal tests in the main paper return null, and the matched comparison shows identical growth rates (3.67% vs. 3.65%, p = 0.98) between high- and low-ADRI autocracies. But bad institutions — specifically, the absence of succession mechanisms, feedback channels, and institutional constraints on leadership — make growth fragile, reversible, and ultimately dependent on the continued presence of a single individual.
Singapore’s Lee Kuan Yew understood this asymmetry: “I would count as my greatest achievement a successor government that is able to carry on as well, if not better, than we did.” Most developmental autocrats do not build institutional insurance because doing so requires constraining their own power for the benefit of successors they may not know and may not trust. The cases confirm that this failure to self-constrain — visible in Ethiopia under Meles, China under Xi, and Rwanda under Kagame — is not a policy error that can be corrected by better advice. It is a structural feature of personalist authoritarianism: the leader’s rational interest in maintaining personal control is incompatible with the institutional requirements for post-leader sustainability.
D.3 The Taxonomy of Institutional Insurance
The cases reveal that institutional insurance takes multiple forms, and no single institutional architecture is universally optimal. The framework identifies five functional requirements — succession, transformation, feedback, transparency, and meritocracy — but these functions can be served through diverse institutional arrangements.
Succession institutionalization can be achieved through democratic elections (Botswana), a party cadre system (Singapore), factional rotation within a dominant party (Japan’s LDP), or collective leadership with Central Committee authority (Vietnam). What matters is not the specific mechanism but whether a rule-governed process exists that can produce leadership change without institutional disruption.
Structural economic transformation can be achieved through state-directed conglomerate building (South Korea’s chaebols), multinational recruitment (Singapore’s EDB strategy), FDI-driven assembly (Vietnam’s Samsung model), or resource-funded investment (Botswana’s diamond revenues). What matters is whether the economy has been restructured to create autonomous productive actors whose output does not depend on any individual leader.
Feedback mechanisms can be provided by genuine multiparty elections (Botswana), calibrated electoral responsiveness within a dominant-party system (Singapore), technocratic policy review institutions (South Korea’s KDI), or collective leadership debate (Vietnam’s Central Committee). What matters is whether the system receives honest information about policy failures and can correct course.
State capitalism transparency can be achieved through publicly reported sovereign wealth funds (Singapore’s Temasek, Botswana’s Pula Fund), commercial law governance of state enterprises, independent auditing, and parliamentary oversight. What matters is whether state economic power is exercised under rules that survive leadership changes.
Civil service independence can be maintained through exam-based recruitment (Singapore’s PSC, South Korea’s civil service examination), merit-based promotion systems, and institutional memory embedded in technocratic agencies (South Korea’s EPB/KDI, Singapore’s EDB/MAS). What matters is whether bureaucratic competence derives from institutional systems rather than from any individual leader’s personal oversight.
D.4 The Implications for Rwanda
The cases collectively produce a sobering assessment for Rwanda and other personalist developmental autocracies. Rwanda under Kagame scores low on every ADRI component: no succession mechanism, limited structural transformation, no genuine feedback channels, opaque state capitalism (Crystal Ventures Limited), and civil service quality dependent on personal presidential oversight. The Ethiopian parallel is precise: Meles’s EPRDF scored similarly on most components, and the system collapsed within six years of the founder’s death.
The framework does not predict that Rwanda will inevitably follow Ethiopia’s trajectory. It predicts that Rwanda faces the same structural vulnerabilities — and lacks the institutional insurance that could mitigate them. The probability of irregular successor exit, estimated at 40% (bootstrap 95% CI: 35-44%) based on ADRI-similar autocracies, is not a certainty but a base rate that reflects the historical experience of institutionally comparable regimes. Some ADRI-similar autocracies have survived leadership transitions; most have not. The framework identifies the specific institutional investments — succession mechanisms, feedback channels, transparent governance — that would reduce Rwanda’s vulnerability, while recognizing that these investments require the leader to constrain his own power in ways that personalist autocrats historically resist.
There is a structural timing paradox: institutional investment is most valuable when it is least politically attractive. Leaders at peak power could most effectively build constraints on successors but have the least incentive to constrain their own authority; leaders in decline face the most urgent need for succession mechanisms but typically lack the power to build them against competitors jockeying for advantage. Singapore, Botswana, and Deng’s China succeeded because their founders combined peak power with willingness to self-limit — a combination that is empirically rare and that the formal model’s comparative statics (Appendix A) predict will be selected against in most personalist regimes.
D.5 Rwanda Comparative Counterfactuals
The Rwanda prediction (ADRI = 0.33, P(irregular exit) = 40%) can be bracketed by comparative counterfactuals.
Burundi — sharing nearly identical geography, colonial history, ethnic composition, and pre-conflict income — provides the closest comparison. The key difference was mode of conflict termination: Rwanda’s RPF achieved decisive military victory; Burundi’s civil war ended through the 2000 Arusha Accords. The divergence is large: Rwanda averaged 7.4% GDP growth (2000–2022) versus Burundi’s 2.4%.
Mozambique illustrates the fragility of revolutionary-movement governance without institutional constraints: FRELIMO achieved $\sim$8% growth for two decades before the tuna bonds scandal revealed \$2 billion in secret borrowing and the country defaulted.
Costa Rica 1948 suggests that decisive military victory need not lead to permanent authoritarianism: Figueres dissolved the army and founded a stable democracy (GDP per capita now \$13,000).
These comparisons suggest that negotiated power-sharing would likely have produced worse economic outcomes, that immediate democratization was probably not feasible, and that the case for continued authoritarianism weakens after the emergency period stabilized ($\sim$2003).
E. Boundary Conditions and Stress Tests
The framework was built from a set of core cases. A useful framework must be tested against cases it was not designed to explain. The seven cases below were selected because each challenges a specific prediction — if the framework cannot account for them, it needs revision.
E.1 Taiwan: Alternative Institutional Authoritarian Architecture
Taiwan achieved institutional authoritarian outcomes through a fundamentally different architecture than Singapore: radical KMT land reform (1949-1953) that converted landlords into industrial capitalists, SME-led “guerrilla capitalism” (Lam (1992)) rather than state-directed conglomerates, and state-seeded technology upgrading through ITRI and TSMC. The Kaohsiung Export Processing Zone (1966) — the world’s first EPZ — and the Hsinchu Science Park (1980) provided state-created infrastructure while leaving allocation to market forces. Morris Chang, recruited from Texas Instruments in 1985, founded TSMC in 1987 as the world’s first dedicated semiconductor foundry — deliberate state industrial policy that operated through technology diffusion rather than state ownership. The democratic transition (martial law lifted 1987, first direct presidential election 1996, first party transfer to DPP in 2000) was driven by the structural transformation creating a dispersed middle class, not regime design. GDP per capita: \$170 (1952) to \$32,000 (2022) — a 190-fold increase. Taiwan confirms that institutional insurance can take radically different forms: no single firm or economic actor depended on the KMT’s continued rule, so the political transition could not destroy the economic foundation.
E.2 India: Democracy Without Capacity
India is the framework’s hardest case — a democracy since 1947, yet the “Hindu rate of growth” (3.5% annually, 1950-1980) produced persistent poverty. The problem was not democracy but low state capacity: the License Raj required up to eighty agencies to approve a single business decision, while the state could not collect taxes efficiently (tax-to-GDP ratio $\sim$11-12%) or deliver services at scale. Manufacturing barely moved: 9% of GDP at independence to 16% by 1991, then back down to 13% by 2022 — workers leaving agriculture entered low-productivity services rather than factories. The 1991 liberalization (Finance Minister Manmohan Singh dismantling the License Raj after a balance-of-payments crisis that required airlifting forty-seven tons of gold to the Bank of England as collateral) addressed the policy constraint without resolving the capacity constraint. India reveals a boundary condition: democratic development requires state capacity just as much as authoritarian development does. Democracy is not a substitute for the ability to govern.
E.3 Tanzania: When Developmental Intent Is Not Enough
Julius Nyerere had a genuinely low discount rate — broad legitimacy, mass party governance, voluntary departure in 1985. Yet Tanzania failed catastrophically. The Arusha Declaration (1967) imposed collectivized agriculture and Ujamaa villagization, forcibly relocating at least five million people. In 1970 Tanzania exported 540,000 tons of surplus maize; by 1974 it was importing 300,000 tons. GDP per capita fell below independence levels. The explanation is economic model, not discount rate. Collectivized agriculture contradicted local knowledge and destroyed production incentives; the state lacked the administrative depth to run a command economy. After Nyerere’s departure and market reforms, growth improved to $\sim$7% since 2000 — but GDP per capita reached \$1,224 only by 2023, a level market-oriented policies might have achieved by the 1980s. The boundary condition: the discount rate framework assumes minimally viable economic policy. A low discount rate sustaining a wrong economic model merely perpetuates failure longer.
E.4 Chile: The Rare Personalist-to-Democratic Transition
Pinochet’s Chile (1973-1990) achieved the rarest outcome: a personalist dictatorship that transitioned to democracy. The Chicago Boys’ radical liberalization produced the 1982 banking crisis (GDP fell 14.3%); the pragmatic phase under Hernan Buchi, supported by CORFO and Fundacion Chile (which created Chile’s salmon industry from scratch — establishing Salmones Antarctica in 1982, then selling it to Japan’s Nippon Suisan Kaisha), produced genuine diversification into salmon, wine, fruit, and forestry. The 1980 Constitution’s plebiscite provision — designed as a confidence vote — backfired: the “No” won with 56% in October 1988. Pinochet explored an auto-coup to annul results (National Security Archive, 2018), but the professional military, whose institutional interests had diverged from his, refused. Air Force Commander Fernando Matthei publicly acknowledged the “No” victory on television, forcing Pinochet’s hand. Growth accelerated under democracy — the Concertacion averaged 7% through the 1990s. Chile’s transition required the convergence of institutional accidents that cannot be planned: constitutional plebiscite, independent electoral tribunal, professional military autonomy, and a diversified economy creating organized private actors independent of regime patronage. Rwanda has none of these escape mechanisms.
E.5 Japan: The Developmental State Lifecycle
Japan is the original developmental state (Johnson (1982)): MITI directing private firms through credit allocation, trade protection, and “administrative guidance,” producing a 140-fold GDP per capita increase (\$180 to \$25,000, 1950-1990). The LDP’s factional (habatsu) system managed the discount rate through internal rotation — fifteen PMs between 1955 and 1993, average cabinet duration 9.4 months — channeling elite competition within institutional boundaries. But Japan demonstrates the lifecycle: miraculous catch-up growth ($\sim$10% in the 1960s) gave way to mature growth ($\sim$4% in the 1970s-80s) and then frontier stagnation ($\sim$1% since 1990). Once Japan reached the technological frontier, MITI could not identify targets; the consensus-oriented, risk-averse apparatus was poorest at fostering venture-capital-driven innovation. The Nikkei has not surpassed its 1989 high — a more-than-thirty-year stagnation. Every developmental state must confront Japan’s Phase 3 problem: the institutional configuration producing miraculous catch-up may not suit frontier innovation.
E.6 Gulf States: Resource Rents and the Succession Problem
Kuwait and the UAE illustrate how resource rents distort the framework. Kuwait has the Gulf’s oldest parliament (National Assembly, elected since 1963) and the world’s oldest sovereign wealth fund (KIA, founded 1953, managing \$1.03 trillion). The 2006 succession crisis — parliament voted unanimously to declare the incapacitated crown prince unfit — demonstrated constitutional succession mechanisms with no Gulf parallel. The UAE has less political institutionalization but more economic diversification: Dubai reduced oil from 50% to under 1% of GDP through Emirates airline, Jebel Ali Free Zone, and DIFC. Resource rents provide financial insurance through succession turbulence — but NEOM (Saudi Arabia’s planned \$500 billion megaproject) illustrates the risk that state-directed capital without accountability produces waste. Oil wealth purchases time, not durability.
E.7 Post-Soviet Divergence: External Anchors
Post-Soviet trajectories reveal the power of external institutional anchors. Poland (\$18,000 GDP per capita by 2022), Estonia (\$28,000), and the Czech Republic (\$27,000) — all EU members — dramatically outperformed Russia and Ukraine (roughly comparable starting conditions to Poland; now 4.7x poorer per capita). Vachudova (2005)’s Europe Undivided (2005) identifies the mechanism: EU conditionality provided a credible reward, external enforcement via the Copenhagen Criteria, elite socialization, and a coordination device for overcoming domestic opposition to reform. Countries without EU membership prospects developed “super-presidential” regimes. The implication: external anchors can substitute for domestic institutional capacity — but the anchor must be credible (Hungary’s backsliding under Orban shows anchoring weakens after accession). For Sub-Saharan Africa, the absence of comparable institutions is a structural disadvantage. The AU lacks the EU’s enforcement mechanisms. Rwanda has no EU equivalent.
E.8 What the stress tests reveal
These seven cases confirm the framework’s core claim while revealing boundary conditions:
-
Economic model matters. Tanzania shows that a low discount rate cannot compensate for a fundamentally wrong economic model.
-
Democratic underperformance is real. India shows that democracy without state capacity produces slow development. Democratic development is not automatic.
-
Personalist regimes can escape — but only through institutional accidents. Chile’s plebiscite was a confidence vote that backfired. Most personalist regimes lack comparable exit mechanisms. Rwanda certainly does.
-
The developmental state has a lifecycle. Japan demonstrates that catch-up institutions become counterproductive at the frontier.
-
Resource wealth creates a time-delayed discount rate. The Gulf states have purchased time, not durability.
-
External institutional anchors can substitute for domestic capacity. EU conditionality worked; its absence in Sub-Saharan Africa worsens the prognosis for personalist regimes like Rwanda.
-
Institutional authoritarian development takes multiple forms. Taiwan achieved comparable durability to Singapore through radically different institutional architecture — dispersed SMEs rather than state-directed conglomerates, land reform rather than public housing, technology diffusion rather than state ownership.
F. Aid, State Capacity, and the Authoritarian Social Contract
Rwanda receives approximately \$85 per capita in foreign aid annually — the highest in East Africa. Aid constituted 86% of the national budget in 2000 and roughly 40% today. This section examines Rwanda’s aid relationship through the lens of state capacity, arguing that both Easterly’s institutionalist critique and Sachs’s resource-gap thesis miss the binding constraint: the ability to convert resources into programs at scale.
F.1 The Easterly-Sachs debate and its limits
Sachs (2005) argues that the binding constraint is capital — aid provides the “big push” needed to escape the poverty trap. Rwanda’s health transformation is his ideal case: Mutuelle de Santé covering 91% of the population, 45,000 community health workers, Zipline drone delivery, an HIV treatment cascade rivaling wealthy nations. But Sachs treats governance as exogenous. Most aid recipients receive comparable per-capita flows and achieve nothing close to Rwanda’s outcomes. The DRC has received more total aid than Rwanda and ranks among the world’s poorest countries. Sachs identifies a necessary condition (resources) but not a sufficient one.
Easterly (2006) argues that the binding constraint is institutions. Aid fails because top-down “planners” cannot know what bottom-up “searchers” need, and aid bypasses the fiscal bargain that creates accountability. Rwanda appears to refute Easterly: centralized planning (Vision 2020, imihigo performance contracts) has achieved targets his framework predicts should fail. But Easterly would respond that these outcomes depend on Kagame personally — and the main paper’s discount rate analysis supports that prediction.
The missing variable is state capacity: the ability to formulate coherent policy AND implement it at scale. State capacity, as Besley and Persson (2011) formalize it, encompasses fiscal capacity, legal capacity, and collective capacity — and is conceptually distinct from both democratic governance (Easterly) and resource adequacy (Sachs). Consider what “implementation at scale” means in Rwanda: Mutuelle de Santé went from 7% coverage in three pilot districts (1999) to 91% nationally by 2020. The Girinka program distributed 427,576 dairy cows, driving annual milk production from 50,000 to 731,000 metric tons — a 14-fold increase. Umuganda contributed \$127 million in labor value (2007–2016). Building near-universal health insurance in a country with GDP per capita of \$1,000 is something countries ten times wealthier have failed to do. These programs require administrative depth that most sub-Saharan African states simply do not possess.
Rajan and Subramanian (2008) conducted the most rigorous cross-country analysis — controlling for endogeneity, geography, institutions, and reverse causality — and found no robust positive relationship between aid and growth. Their null result is consistent with the state capacity framework: aid works where state capacity exists and fails where it doesn’t, and since most recipients lack capacity, the average effect washes out. Rwanda is not evidence that “aid works.” It is evidence that “aid + state capacity works” — and the state capacity is doing most of the analytical lifting.
The policy question is therefore not “should we give aid?” (Sachs) or “should we stop giving aid?” (Easterly and Moyo) but “how do we build state capacity in countries that lack it?” Rwanda’s answer — authoritarian concentration of power — is neither replicable nor, per the discount rate analysis, sustainable. But it is also the only answer that has worked at this scale in post-conflict sub-Saharan Africa, which is why the question remains genuinely hard.
F.2 The social contract problem
Deaton (2013) identifies the deeper structural issue: non-tax revenue breaks the fiscal bargain. Governments flush with aid can maintain power without democratic accountability. Research finds that aid “neither improves nor deteriorates political governance, but essentially amplifies recipients’ existing political-institutional orientations: aid makes dictatorships more dictatorial and democracies more democratic.”
Rwanda partially escapes this critique: the Rwanda Revenue Authority is one of Africa’s most effective, and domestic revenue constitutes 58% of the 2022/23 budget. Kagame endorsed Moyo (2009)’s Dead Aid (2009) — “one of the most compelling cases for a new approach to Africa” — even as 40% of his budget comes from aid. But Rwanda’s governance accountability runs to the presidency and the RPF, not to citizens through democratic mechanisms. The fiscal bargain exists between Rwanda and its donors, not between the Rwandan state and Rwandan citizens. Technocratic effectiveness without democratic accountability is not a genuine social contract — it is a managed dependency where the relevant constituency is in Washington and Brussels, not in Kigali’s suburbs or rural hillsides.
This creates a paradox: the better Rwanda performs on the metrics donors value, the less pressure it faces to democratize — and the less it democratizes, the more dependent its developmental performance remains on a single leader’s continued competence and commitment. Aid has funded the construction of a development model that works brilliantly in the short term and is structurally fragile in the long term.
F.3 The Congo dimension
Rwanda’s involvement in the DRC reveals structural limits the standard development indicators miss. UN investigators documented “critical support” to M23 rebels (UN Group of Experts, 2022), with Rwandan troops, weapons systems, and mineral extraction from seized territory — notably the Rubaya mine in North Kivu, which accounts for roughly 15% of the world’s coltan supply. Rwanda’s mineral exports consistently exceed domestic production capacity.
Collier (2007)’s “conflict trap” from The Bottom Billion (2007) illuminates the dynamic: low income creates conflict risk, conflict destroys growth, and post-conflict countries face roughly 50% relapse rates within a decade. Rwanda has escaped its own conflict trap but is actively perpetuating the DRC’s — a cross-border variant of the resource curse where one country extracts resources from a conflict-weakened neighbor, ensuring the instability that makes continued extraction possible.
Global Witness’s 2022 investigation, “The ITSCI Laundromat,” found the mineral traceability scheme designed to ensure conflict-free supply chains has been systematically compromised. A former manager of Pact estimated that fraudulent tagging accounted for up to 90% of exported 3T minerals from Rwanda during the scheme’s early years. In one mining area, up to 90% of minerals introduced into the scheme in Q1 2021 did not come from validated mines. End products potentially reach Apple, Intel, Samsung, Nokia, and Tesla. The system suffers from a structural conflict of interest: ITSCI is funded by levies paid by mineral exporters, creating perverse incentives to tag minerals regardless of origin.
The DRC involvement matters for three reasons. First, domestic anti-corruption metrics (CPI 43rd globally) do not capture cross-border resource extraction through military proxies — a government that is simultaneously “clean” domestically and running a cross-border military extraction operation is not straightforwardly clean. Second, it threatens the aid model: several donors have suspended or reviewed bilateral aid over DRC concerns. Third, the fiscal logic is circular: if aid cuts reduce revenue, Rwanda’s incentive to intensify mineral extraction from the DRC increases — meaning the aid literature’s prescription (reduce aid to promote accountability) could worsen the conflict literature’s problem (resource-fueled proxy warfare). Neither body of literature alone captures this dynamic.
These aid suspensions interact with a broader shift: Rwanda’s aid relationship has been shaped by a “genocide credit” — Western guilt over 1994 converting moral debt into fiscal generosity with minimal conditionality. This credit may be expiring as a new generation of donor-country policymakers, who did not experience the failure to intervene, feels less constrained by inherited guilt — particularly when the government that stopped the genocide is documented to be perpetrating military aggression in a neighboring country.
F.4 Synthesis: the modified aid curse
Rwanda represents a modified aid curse — aid has not created kleptocracy, but it has sustained an authoritarian regime that might otherwise face domestic pressure for liberalization. Rwanda simultaneously proves and breaks the aid literature. It proves that aid can produce genuine outcomes when state capacity exists. It breaks the assumption, shared by both Easterly and Sachs, that the governance question has a simple answer. The binding constraint is neither resources nor institutions in isolation — it is the state capacity to convert one into the other. And that capacity, in Rwanda’s case, is embodied in a man, not embedded in a system. When the man departs, the capacity departs with him — unless, before then, it is institutionalized.
The aid relationship should be evaluated not by whether it produces current outcomes (it does) but by whether it contributes to the institutionalization that will determine whether those outcomes survive the founder. By this criterion, thirty years of aid to Rwanda have failed. The outcomes are real. The institutionalization is not.