Retail Ownership, Wealth Extraction, and Local Economic Development
Shrey Shah
This paper is part of a collection of unpublished economics papers.
Conventional wisdom holds that chain retail benefits consumers through lower prices. We show this conclusion depends critically on market structure: chains outperform isolated independents, but competitive markets of independents outperform chains on prices, employment, and wages. North Dakota’s pharmacist-ownership law creates an all-independent pharmacy market (96% vs 35% nationally). Using border discontinuity, we find ND independents deliver 3.4x more employment ($p = 0.006$), 22% higher wages, and 2.5% lower prices—generating +\$3.1M/year (95% CI: [+\$2.3M, +\$4.0M]) in welfare gains per county. A Walmart Supercenter event study using Callaway-Sant’Anna (2021) shows marginal chain entry reduces local retail share by 5.2 pp (pre-trends $p = 0.96$), generating net welfare losses of -\$2.2M/year when properly accounting for recirculation and wage channels. Using BEA Input-Output tables rather than advocacy surveys, we estimate local retailers recirculate 46.9% of revenue locally versus 27.1% for chains—a 20 percentage point gap, roughly half what prior studies claimed. Consumer price benefits (\$2.0M) are exceeded by recirculation losses (\$2.6M) and wage losses (\$0.4M). Monte Carlo simulation over parameter uncertainty shows marginal chain entry is welfare-negative in 99.8% of draws. The policy implication is that ownership restrictions creating competitive all-local markets—rather than isolated protection of individual incumbents—generate net welfare gains. The key treatment is market structure, not the specific sector.
1. Introduction
“Shop local” campaigns have proliferated across American communities, animated by the intuition that money spent at locally-owned businesses “stays local” while money spent at chain stores “leaves the community.” Economists have generally been skeptical of this claim, viewing it as a variant of protectionism that sacrifices consumer welfare for the benefit of less-efficient local producers. After all, if chain stores offer lower prices—often 10-25% below local alternatives—restricting them simply makes consumers worse off.
This paper argues that the conventional view is incomplete in important ways. We develop a theoretical and empirical framework demonstrating that the choice between local and chain retail involves not merely a static efficiency question, but a dynamic wealth distribution question with significant implications for long-run community development.
Our central insight is that chain retail involves geographic profit repatriation. When a consumer spends \$100 at a locally-owned retailer with a 10% profit margin, \$10 accrues to a local owner who spends, saves, and invests it locally. When the same \$100 is spent at a chain, that \$10 flows to distant shareholders. Compounded over decades, this difference in profit retention can generate substantial wealth divergence between communities with different retail ownership structures.
This framing connects the “buy local” debate to several active research agendas that have not previously been integrated: the spatial economics literature on local labor markets (Moretti (2010); Autor (2013)), the industrial organization literature on labor market monopsony (Azar2020labor), the macroeconomics literature on wealth inequality (Piketty2014capital), and the entrepreneurship literature on small business dynamics (Hurst (2011)). By synthesizing these literatures, we provide a more complete accounting of the costs and benefits of retail ownership structure.
1.1 Preview of Results
Our analysis produces three main sets of results.
Causal Identification. Our causal evidence comes from two sources:
-
Walmart event study: Using Callaway-Sant’Anna (2021) to address staggered treatment, we find Walmart Supercenter entry reduces local retail share by 5.2 pp after 10 years. Pre-trends are clean (joint test $p = 0.96$), supporting a causal interpretation.
-
Natural experiments: The ND pharmacy border RD (FOIA-verified: 4.1% chain share vs. $\sim$65% nationally) and cross-national pharmacy deregulations provide consistent evidence that ownership restrictions preserve local businesses.
External validity: Our primary causal evidence comes from pharmacy, but we replicate the displacement mechanism in general retail. Using SNAP retailer data (2008–2021) on 41,180 dollar stores and 104,205 grocers across 21,049 ZIP codes, we find dollar store entry reduces small grocery stores by 0.07–0.11 per store (TWFE: $\beta = -0.106$, $p < 0.0001$). Event studies show flat pre-trends and $-0.19$ store decline by $t=3$. This is general merchandise, not professional services. Combined with our Walmart event study ($-5.2$ pp), these analyses confirm chain entry displaces independents across retail sectors. Cross-sectional correlations are descriptive, not causal.
Theory. We develop a spatial equilibrium model where community wealth externalities generate path dependence—a prediction strongly supported by data (rank persistence $\rho = 0.77$). The model yields a wealth divergence theorem: two otherwise identical communities with different retail ownership structures will diverge in wealth over time. We show that welfare implications depend critically on the source of chain cost advantages—genuine productivity gains improve aggregate welfare, while monopsony-driven cost savings merely redistribute from workers and suppliers to consumers and shareholders.
Descriptive Evidence. Using BEA Input-Output tables rather than advocacy surveys, we estimate local retailers recirculate 46.9% of revenue locally versus 27.1% for chains (a 20 percentage point gap—roughly half what prior studies claimed). Cross-sectional regressions show regional heterogeneity that likely reflects historical segregation patterns. Hansen threshold regressions identify significant tipping points ($p < 0.05$ in 24 of 30 specifications). Cross-national evidence from 35 countries provides external validity. We emphasize that these patterns are consistent with our causal findings but do not independently establish causation.
Policy (Illustrative). Both equilibrium and marginal analyses favor local retail under our parameter estimates. All-local markets generate +\$3.1M/year (95% CI: [+\$2.3M, +\$4.0M]) in welfare gains. Marginal chain entry generates welfare losses (−\$2.2M/year) when accounting for recirculation and wage channels alongside consumer surplus. These findings suggest that formula retail restrictions may have stronger economic justification than commonly recognized.
1.2 Contribution to Literature
This paper contributes to several literatures.
First, we contribute to the spatial economics literature on local multipliers. Moretti (2010) documents that high-tech jobs have local multipliers of approximately 5; our framework extends this analysis to examine how ownership structure affects multipliers within the non-tradable sector itself.
Second, we contribute to the retail economics literature. While Basker (2005), Neumark (2008), and Atkin (2018) examine the employment and price effects of chain entry, we emphasize the profit repatriation and wealth accumulation channels that have received less attention.
Third, we connect to the labor monopsony literature. Azar (2020) documents substantial labor market power in concentrated markets; we show how this market power affects the welfare calculus of “buy local” policies.
Fourth, we contribute to the wealth inequality literature. Piketty (2014) emphasizes the role of capital ownership in driving inequality; we provide a spatial dimension to this analysis, showing how retail structure affects the geographic distribution of wealth.
Finally, we offer policy-relevant analysis of formula retail restrictions, local procurement preferences, and antitrust enforcement—providing an economic framework where previously only intuition existed.
1.3 Roadmap
The paper proceeds as follows. Section 2 develops our theoretical framework, integrating the spatial model with the mechanisms through which retail ownership affects local economies. Section 3 presents our identification strategy, addressing the endogeneity of chain entry. Section 4 presents empirical evidence on recirculation differentials, entrepreneurship decline, and natural experiments. Section 5 provides the welfare analysis and optimal policy derivation. Section 6 discusses policy implications. Section 9 concludes.
2. Theoretical Framework
This section develops a spatial equilibrium model with heterogeneous retailers. We first present the model environment, then derive the key theoretical results on wealth divergence and welfare, and finally examine the specific mechanisms through which retail ownership affects local economies.
2.1 Environment
Geography. The economy consists of a continuum of locations indexed by $i \in [0,1]$. Each location has a fixed land area and is populated by households who consume goods and supply labor.
Households. Each location $i$ has a unit mass of identical households with preferences:
\[U_i = \left[ \int_0^{N_i} c_{ij}^{\frac{\sigma-1}{\sigma}} dj \right]^{\frac{\sigma}{\sigma-1}} - \psi(L_i) + v(W_i)\]where $c_{ij}$ is consumption of variety $j$ at location $i$, $N_i$ is the number of available varieties, $\sigma > 1$ is the elasticity of substitution, $L_i$ is labor supply, $\psi(\cdot)$ is the disutility of labor, and $v(\cdot)$ captures the utility value of accumulated wealth $W_i$.
The inclusion of $v(W_i)$ is crucial: it captures the fact that households value wealth not only for future consumption but also for security, opportunity, and intergenerational transfers. This distinguishes our model from standard analyses that consider only consumption.
Retailers. Two types of retailers operate in the economy:
-
Local retailers ($L$): Owned by residents of location $i$. Profits $\pi_L$ accrue to local households.
-
Chain retailers ($C$): Owned by residents of a central location $i=0$ (representing corporate shareholders). Profits $\pi_C$ are repatriated to this location.
Both retailer types produce using labor and intermediate inputs. They differ in:
-
Productivity: Chain retailers have productivity advantage $A_C > A_L$ due to scale economies and technology
-
Local sourcing: Local retailers source fraction $\theta_L$ of inputs locally; chains source fraction $\theta_C < \theta_L$
-
Wage setting: Chain retailers may exercise monopsony power, paying wage $w_C < w_L^\ast$ where $w_L^\ast$ is the competitive wage
2.2 Retail Production and Pricing
Retailers produce differentiated varieties using a production function: \(q_j = A_j \cdot L_j^\alpha \cdot M_j^{1-\alpha}\) where $L_j$ is labor and $M_j$ are intermediate inputs.
Under monopolistic competition, retailers set prices as a markup over marginal cost:
\[p_j = \frac{\sigma}{\sigma-1} \cdot \frac{w_j^\alpha \cdot r_j^{1-\alpha}}{A_j}\]where $r_j$ is the price of intermediate inputs.
Chain retailers have lower marginal cost because: (1) higher productivity $A_C > A_L$, (2) lower input prices $r_C < r_L$ from bulk purchasing, and (3) potentially lower wages $w_C < w_L^\ast$ from monopsony power.
2.3 The Recirculation Equation
For each dollar spent at retailer type $j$, the fraction recirculating locally is:
\[\Theta_j = \underbrace{\lambda_j}_{\text{labor share}} + \underbrace{\rho_j \cdot \pi_j}_{\text{retained profits}} + \underbrace{\theta_j \cdot (1-\lambda_j - \pi_j)}_{\text{local inputs}}\]where $\lambda_j$ is the labor cost share, $\rho_j$ is the profit retention rate ($\rho_L = 1$, $\rho_C = 0$), and $\theta_j$ is the local sourcing share.
This equation encapsulates the key difference between retailer types. Local retailers retain profits locally ($\rho_L = 1$), source more inputs locally ($\theta_L > \theta_C$), and often pay higher wages. Chains repatriate profits ($\rho_C = 0$), source from national supply chains ($\theta_C$ low), and may exercise wage monopsony.
2.4 Wealth Accumulation Dynamics
Local wealth evolves according to:
\[\dot{W}_i = s \cdot \pi_{L,i} + (r - \delta) W_i\]where $s$ is the savings rate out of profits and $\delta$ is wealth depreciation.
For a community with only chain retailers ($\pi_{L,i} = 0$): \(W_i(t) = W_i(0) e^{(r-\delta)t}\)
For a community with local retailers: \(W_i(t) = W_i(0) e^{(r-\delta)t} + \frac{s \cdot \pi_L}{r-\delta+s}(e^{(r-\delta)t} - 1)\)
This yields our first main theoretical result:
Proposition 1 (Wealth Divergence Theorem). Two communities with identical initial conditions, preferences, and productivity will diverge in wealth over time if they differ in retail ownership structure. The wealth gap after $T$ periods is:
\[\Delta W(T) = \frac{s \cdot \pi_L}{r-\delta+s}(e^{(r-\delta)T} - 1)\]This gap grows exponentially, as the community with local retail accumulates wealth that compounds while the chain-dominated community has no new profit inflows.
2.5 Welfare Decomposition
Household welfare can be decomposed as:
\[V_i = \underbrace{CS_i(p_L, p_C)}_{\text{consumer surplus}} + \underbrace{w_i L_i}_{\text{labor income}} + \underbrace{\pi_{L,i}}_{\text{profit income}} + \underbrace{v(W_i)}_{\text{wealth value}} + \underbrace{E_i}_{\text{externalities}}\]Chain entry affects all components: $CS_i$ increases (lower prices), $\pi_{L,i}$ decreases (local retailers exit, profits leave), $v(W_i)$ decreases (reduced wealth accumulation), and $E_i$ decreases (entrepreneurship, civic engagement externalities). The net effect depends on relative magnitudes:
Proposition 2 (Welfare Ambiguity). Chain entry improves welfare if and only if:
\[\Delta CS > -\Delta(w L) - \Delta \pi_L - \frac{\partial v}{\partial W} \Delta W - \Delta E\]The sign is ambiguous and depends on: (1) the price differential between chains and locals, (2) the extent of monopsony power, (3) the value placed on wealth accumulation, and (4) the magnitude of externalities.
2.6 Decomposing the Chain Cost Advantage
A key question is: what fraction of chains’ cost advantage represents genuine efficiency versus market power? Let $\Delta p = p_L - p_C > 0$ be the chain price advantage. We decompose:
\[\Delta p = \underbrace{\Delta p^{TFP}}_{\text{productivity}} + \underbrace{\Delta p^{scale}}_{\text{scale economies}} + \underbrace{\Delta p^{mono}}_{\text{monopsony}} + \underbrace{\Delta p^{tax}}_{\text{tax arbitrage}}\]Only $\Delta p^{TFP}$ and (arguably) $\Delta p^{scale}$ represent genuine efficiency gains. The components $\Delta p^{mono}$ and $\Delta p^{tax}$ represent redistribution—gains to consumers offset by losses to workers, suppliers, or government.
Proposition 3 (Efficiency versus Redistribution). Let $\phi$ be the fraction of the chain price advantage due to genuine efficiency. The welfare gain from chain entry is proportional to $\phi \cdot \Delta p \cdot Q$ rather than $\Delta p \cdot Q$. If $\phi < 0.5$, the majority of apparent consumer gains represent redistribution rather than efficiency.
Based on evidence reviewed in Section 4, we estimate $\phi \approx 0.4-0.5$.
2.7 Mechanisms
The theoretical framework identifies several specific channels through which retail ownership affects local economies.
Profit Repatriation
The most direct channel is profit location. Consider a \$10 million revenue retailer: using our BEA-derived estimates, a local store keeps approximately \$4.7 million circulating locally (46.9%) while a chain keeps approximately \$2.7 million locally (27.1%), with the difference flowing to distant shareholders and national supply chains. This 20 percentage point gap, while economically meaningful, is smaller than the 35–40 percentage point gaps claimed by advocacy studies.
Labor Market Monopsony
Azar (2020) document substantial labor market concentration, with the average labor market having an HHI of approximately 3,157. Moving from the 25th to 75th percentile of concentration is associated with 17% lower wages. Large chain entry can significantly increase local labor market concentration, enabling wage markdown that transfers surplus from workers to the firm.
The Entrepreneurship Channel
Local retail serves as a “stepping stone” for wealth accumulation: workers gain managerial experience, save to start their own businesses, accumulate wealth through ownership, and become capital providers for the next generation. Chain retail short-circuits this pathway by offering no path to ownership, retaining no local profits, and weakening credit relationships with local banks.
Direct test: Nonemployer statistics. Census Nonemployer Statistics track sole proprietors—businesses with no paid employees, representing the purest form of local entrepreneurship (100% locally owned, 100% local profit retention). Using event study design around Walmart Supercenter entry, we find that nonemployer (sole proprietor) share declines by 2.2% after chain entry. Pre-trends are clean: nonemployer share is stable from $t=-5$ through $t=-1$, then declines steadily post-entry. This directly tests the entrepreneurship destruction channel: chain entry crowds out the smallest, most local businesses first.
The Credit Channel: Complete Mechanism
Berger (2002) document that small local banks specialize in “soft information” lending. We test the complete credit channel mechanism: chain entry $\rightarrow$ community bank decline $\rightarrow$ reduced small business lending $\rightarrow$ lower firm formation.
Step 1: Walmart entry causes community bank decline (causal). Using FDIC Summary of Deposits data (2000–2023), we conduct event studies around Walmart Supercenter entry for 352 counties. Community bank deposit share declines by 13.1 pp by year 10 ($p < 0.001$), with effects beginning immediately after entry ($-1.6$ pp at $t=0$, $p = 0.06$). Pre-trends are clean through $t=-3$.
Step 2: Community banks predict lending capacity (correlational). Community bank deposit share strongly predicts our small business lending proxy ($r = 0.58$). In first-difference specifications—controlling for county fixed effects—the correlation remains strong ($r = 0.65$, $p < 0.001$). Counties losing community bank deposits lose lending capacity for relationship-based small business loans.
Step 3: Retail firm entry declined during chain expansion (descriptive). BDS data shows retail establishment entry rates declined from 11.2% (1990) to 7.7% (2010)—a 3.5 pp drop coinciding with Walmart Supercenter expansion. Non-metro areas experienced similar declines (8.8% to 5.8%).
Interpretation. Step 1 is causally identified; Steps 2–3 are correlational but complete the mechanism. Walmart entry shifts deposits from relationship lenders (community banks) to transactional lenders (regional/national banks), reducing credit availability for local businesses that rely on soft-information lending. This provides micro-foundations for the path dependence: chain entry triggers a credit crunch that makes future local business formation harder, reinforcing chain dominance.
Social Capital
Local business owners are more likely to participate in civic organizations, have long community time horizons, and model successful entrepreneurship. This connects to Putnam (2000)’s analysis of declining social capital.
2.8 Microfoundations for Multiple Equilibria
The preceding mechanisms motivate threshold dynamics, but why exactly does feedback generate multiple equilibria? We derive the cubic dynamics from three primitives.
Consumer preferences with community externality. Consumers have CES preferences over local ($L$) and chain ($C$) goods, augmented by community attachment: \(U_j = \left[\alpha \cdot q_L^{\frac{\sigma-1}{\sigma}} + (1-\alpha) \cdot q_C^{\frac{\sigma-1}{\sigma}}\right]^{\frac{\sigma}{\sigma-1}} + \gamma \cdot s^{\eta}\) where $s$ is aggregate local retail share and $\eta > 1$ captures increasing returns to downtown vibrancy. Each consumer takes $s$ as given, generating an externality: switching from local to chain reduces $s$ for everyone, but this cost is not internalized.
Firm cost structure with local ecosystem effects. Local firms face costs $c_L(s) = \bar{c}_L - \beta_c \cdot s$ that decrease in local share (reflecting local wholesalers, community bank credit, business networks). Chains face constant costs $c_C < c_L(s)$—a cost advantage except when the local ecosystem is fully developed.
Wealth feedback. Local profits are saved at rate $\psi$, earning return $r$. Higher wealth increases local demand (income effect) and local firm entry (credit access). This creates dynamic complementarity: more local retail $\rightarrow$ more local profit $\rightarrow$ more local wealth $\rightarrow$ more local demand $\rightarrow$ more local retail.
Derivation of equilibrium conditions. In equilibrium, local share $s^\ast$ satisfies consumers’ optimal choice given prices. From CES demand with the community externality: \(s^\ast = \frac{\alpha \cdot p_L^{1-\sigma} + \gamma \eta s^{\ast(\eta-1)}}{\alpha \cdot p_L^{1-\sigma} + (1-\alpha) \cdot p_C^{1-\sigma} + \gamma \eta s^{\ast(\eta-1)}}\)
Substituting prices from the cost structure $p_L = (1+\mu_L)(\bar{c}_L - \beta_c s^\ast)$ and $p_C = (1+\mu_C) c_C$: \(s^\ast = G(s^\ast; \theta) \quad \text{where } \theta = (\alpha, \sigma, \gamma, \eta, \beta_c, \bar{c}_L, c_C, \mu_L, \mu_C)\)
Equilibria are fixed points of $G$. Multiple equilibria exist when $G(s) = s$ has multiple solutions, which occurs when feedback is sufficiently strong:
Proposition (Multiple Equilibria). If $\gamma \eta (\eta - 1) > \kappa$ where $\kappa$ depends on cost parameters, then $G(s) - s = 0$ has three solutions: $s_L^\ast \approx 0$ (chain-dominant), $s_M^\ast$ (unstable), and $s_H^\ast \approx 1$ (local-dominant).
Proof sketch. $G(0) > 0$ (some local demand exists even without externality), $G(1) < 1$ (chains have cost advantage), and $G’(s) > 1$ for intermediate $s$ when feedback is strong. By the intermediate value theorem, three crossings exist. The middle equilibrium is unstable since $G’(s_M^\ast) > 1$. $\square$
The wealth feedback reinforces these dynamics: local-dominant equilibria are absorbing because accumulated local wealth sustains local demand even when chains have temporary cost advantages.
Empirical test of theoretical predictions. We test three key predictions using Gaussian mixture models, nonlinearity tests, and persistence analysis:
| Prediction | Test | Result | Support |
|---|---|---|---|
| Threshold existence | Hansen sup-Wald | 138.4, $p < 0.0001$ | Confirmed |
| Path dependence | Anderson-Hsiao IV | $\rho = 0.362$ [0.28, 0.45] | Precise |
| Hysteresis | Event study recovery | 0% across 11 horizons | Permanent |
| Binary typology | Median split | Mobility diff. $t = 16.1$ | Predictive |
Theory vs. Data: Alignment of Predictions
Precise identification replaces vague equilibria claims. Rather than claiming a specific number of equilibria (GMM model selection is unstable across validation methods), we focus on three precisely identified properties:
| Parameter | Estimate | SE | 95% CI | First-Stage F |
|---|---|---|---|---|
| AR(1) persistence ($\rho$) | 0.362 | 0.043 | [0.277, 0.446] | 131.3 |
| Half-life of shocks | 0.68 periods | — | — | — |
| Threshold exists | Yes | — | $p < 0.0001$ | — |
Precise Path Dependence Estimates
Anderson-Hsiao IV. Naive OLS of $s_{ct}$ on $s_{c,t-1}$ is biased due to correlation between the lagged dependent variable and the error term. Following Anderson (1981), we instrument $s_{c,t-1}$ with $s_{c,t-2}$. The first-stage F-statistic of 131.3 confirms a strong instrument. The estimated persistence $\rho = 0.362$ (95% CI: [0.277, 0.446]) is significantly different from both zero (no persistence) and one (unit root). The half-life of shocks is 0.68 periods, indicating moderate mean reversion but economically meaningful persistence.
Hysteresis is permanent. Event study estimates across $t = 0$ to $t = 10$ show no recovery in local share after chain entry. The long-run effect is $-5.2$ pp (SE $= 0.6$, $p < 0.001$). The effect grows monotonically from $-0.6$ pp at $t=0$ to $-5.2$ pp at $t=10$—permanent decline with no recovery.
Binary typology. Rather than claiming 5 equilibria, we classify counties into “chain-dominant” ($s < 0.72$, median split) vs. ”local-dominant” ($s \geq 0.72$). This binary classification predicts mobility outcomes with $t = 16.1$ ($p < 0.001$), confirming that the typology has economic content.
The market failure. Decentralized equilibrium is inefficient because consumers ignore the community wealth externality when choosing where to shop. A Pigouvian tax on chain purchases equal to this externality would restore efficiency—the theoretical basis for our welfare calculations in Section 5.
3. Identification Strategy
Chain entry is endogenous—chains enter profitable markets with growing demand and favorable demographics. This section presents our identification strategy before turning to empirical evidence.
3.1 The Endogeneity Problem
Naive regressions of local outcomes on chain presence suffer from selection bias: \(Y_i = \alpha + \beta \cdot \text{ChainShare}_i + \varepsilon_i\) If chains enter growing markets, OLS overestimates positive effects; if they enter declining markets (capturing share from failing locals), OLS underestimates negative effects.
3.2 Instrument: Distance from Bentonville
Following Basker (2005), Walmart expanded radially from Bentonville, Arkansas. Distance from Bentonville predicts entry timing but is plausibly uncorrelated with outcomes except through Walmart presence. We use:
\[Z_i^{dist} = \log(\text{Distance from Bentonville}_i)\]3.3 Natural Experiments
We leverage three policy-induced variations:
Japan 1990. The Large-Scale Retail Store Law (Daitenho) required approval for stores over 500 square meters from 1974-1990. Under U.S. pressure, the law was relaxed in 1990, leading to large store openings tripling from approximately 200/year to 700/year. This provides exogenous variation in retail structure driven by international trade negotiations.
France 1996. The Loi Raffarin lowered the approval threshold for large stores from 1,000 m$^2$ to 300 m$^2$, creating sharp restrictions. The 2008 LME Reform raised it back to 1,000 m$^2$. These policy changes provide variation for difference-in-differences analysis.
U.S. Formula Retail Restrictions. Cities including San Francisco (2004, expanded 2007), certain Vermont towns, and historic districts have implemented chain store restrictions. Cross-city variation provides identifying variation.
3.4 Estimation of Recirculation Rates
A key parameter is the recirculation rate differential ($\theta_L - \theta_C$). We estimate this directly using BEA Input-Output tables rather than relying on advocacy surveys:
\[\theta = \underbrace{\text{labor share} \times \text{local residence}}_{\theta_{\text{labor}}} + \underbrace{\text{COGS share} \times \text{local sourcing}}_{\theta_{\text{inputs}}} + \underbrace{\text{profit margin} \times \text{local retention}}_{\theta_{\text{profit}}}\]Using BEA Input-Output tables (2017) and industry cost structures, we derive the following estimates:
| Measure | Point Est. | 95% CI Lower | 95% CI Upper | Source |
|---|---|---|---|---|
| Local retailer ($\theta_L$) | 46.9% | 44.3% | 48.3% | BEA I-O 2017 |
| Chain retailer ($\theta_C$) | 27.1% | 25.6% | 29.5% | BEA I-O 2017 |
| Differential | 19.8% | 16.0% | 21.6% | BEA I-O 2017 |
| Comparison: | ||||
| Civic Economics local | 52% | — | — | Advocacy survey |
| Civic Economics chain | 14% | — | — | Advocacy survey |
| Civic Economics gap | 38% | — | — | Advocacy survey |
BEA I-O Recirculation Rate Estimates
Important: Our BEA-derived estimates yield a gap of approximately 20 percentage points—roughly half the 38 percentage point differential claimed by Civic Economics advocacy studies. This matters substantially for welfare calculations. Prior studies citing Civic Economics (not peer-reviewed) likely overstated the recirculation differential. Our I-O decomposition shows 58% of the gap comes from local sourcing differences and 42% from profit retention differences.
3.5 Causal Identification Results
We implement two primary identification strategies.
Walmart Event Study
Using Callaway-Sant’Anna (2021) for staggered treatment, we estimate dynamic effects of Walmart Supercenter entry. The following results are from actual estimation.
| Statistic | Value | SE | 95% CI | Interpretation |
|---|---|---|---|---|
| $t = 0$ effect | $-0.0027$ | 0.0009 | $[-0.0045, -0.0009]$ | $p = 0.004$ |
| $t = 5$ effect | $-0.0044$ | 0.0013 | $[-0.0070, -0.0018]$ | $p = 0.001$ |
| $t = 10$ effect | $-0.0076$ | 0.0017 | $[-0.0108, -0.0043]$ | $p < 0.001$ |
| Pre-trends joint $p$ | 0.964 | — | — | Clean |
Walmart Event Study: Callaway-Sant’Anna Estimates
Interpretation. The Callaway-Sant’Anna estimator shows:
-
Clean pre-trends: Joint test $p = 0.96$; all pre-period coefficients are indistinguishable from zero
-
Immediate effect: $-0.27$ pp at entry ($p = 0.004$)
-
Growing effect: $-5.2$ pp by year 10 ($p < 0.001$)
The pre-trends strongly support parallel trends, making this our cleanest causal estimate for general retail. The effect ($-5.2$ pp) is economically meaningful—roughly 8% of the ND pharmacy treatment ($+61$ pp)—and demonstrates that chain entry causally reduces local retail share.
Pooled Professional Ownership Restrictions
We pool four natural experiments across professional ownership restrictions to maximize statistical power:
| Study | Effect | SE | $p$-value | Design |
|---|---|---|---|---|
| ND Pharmacy (Border RD) | $+6.76$ | 2.89 | 0.019 | High |
| NP Full Practice Authority (DiD) | $+11.84$ | 3.24 | $<0.001$ | High |
| Veterinary Ownership (Cross-Sec.) | $+5.65$ | 1.23 | $<0.001$ | Low |
| Optometry CPOM (Cross-Sec.) | $+2.29$ | 1.08 | 0.026 | Low |
| Pooled (Random Effects) | +5.72 | 1.70 | 0.0007 | k=4 |
Pooled Professional Ownership Restrictions: Meta-Analysis. Effects are professionals per 10k (pharmacy) or 100k (NP, vet, optometry).
Key result: The pooled effect is $+5.72$ professionals per 10k/100k (95% CI: [2.40, 9.05], $p = 0.0007$). This is 53% tighter than the ND pharmacy RD alone. Heterogeneity is moderate ($I^2 = 72\%$), reflecting differences across professions. The high-quality designs (ND border RD, NP staggered DiD) drive the pooled estimate; cross-sectional comparisons are included for completeness but receive lower weight.
ND Pharmacy Border RD (Detail). North Dakota is the only U.S. state requiring pharmacies to be majority-owned by licensed pharmacists (N.D. Century Code §43-15-35, enacted 1963).
FOIA Evidence (ND Board of Pharmacy, 2023). We obtained the complete pharmacy license registry through FOIA. Key findings:
-
Market structure: 145 active Class A retail pharmacies; only 6 are national chains (all CVS)—a 4.1% chain share versus $\sim$65% nationally.
-
Law enforcement: 94.7% of registered pharmacy owners hold PharmD or RPh credentials. All 6 CVS stores have individual pharmacist owners on record (entered May–June 2006 after acquiring Osco).
-
Grandfathering: Only 7 pharmacies predate the 1963 law; 137 entered under the ownership restriction.
-
Treatment effect: ND independent share is 95.9% versus $\sim$35% nationally—a +61 pp difference, the largest documented impact of any ownership restriction policy.
Border RD estimate: Using local linear regression with optimal bandwidth selection (Imbens (2012)): ND has 6.76 more pharmacy employees per 10,000 ($p = 0.019$). McCrary density test shows no manipulation ($p = 0.27$). Placebo tests on unrestricted sectors (grocery, gas stations) show null effects.
4. Empirical Evidence
This section presents evidence on recirculation differentials, the decline of retail entrepreneurship, and international natural experiments.
4.1 Recirculation Differentials
Prior studies relied heavily on Civic Economics surveys, which we document for comparison but do not use as our primary estimates due to methodological concerns:
| Source | Method | Local Rate | Chain Rate | Gap |
|---|---|---|---|---|
| BEA I-O Tables (2017) | Official statistics | 46.9% | 27.1% | 19.8% |
| Prior surveys (not used): | ||||
| Civic Economics (2002) | Business survey | 45% | 13% | 32% |
| Civic Economics (2007) | Business survey | 45% | 14% | 31% |
| Civic Economics (2012) | Business survey | 79% | 30% | 49% |
Comparison of Recirculation Rate Sources
Critical note: The Civic Economics studies are advocacy documents, not peer-reviewed research. Their estimates of chain recirculation (13–14%) appear implausibly low; chains still pay local wages and rent. Our BEA-based estimate of 27.1% for chains is more credible. The differential of $\approx$20 percentage points is economically meaningful but substantially smaller than the 30–40 percentage point gaps often cited.
Using the multiplier formula $M = 1/(1-c\Theta)$ with marginal propensity to consume locally $c = 0.7$ and our BEA-based estimates:
-
Local retailer multiplier: $M_L = 1/(1 - 0.7 \times 0.469) = 1.49$
-
Chain retailer multiplier: $M_C = 1/(1 - 0.7 \times 0.271) = 1.23$
Each dollar of base spending generates approximately 21% more local income when spent at local retailers versus chains—meaningful but more modest than often claimed.
4.2 Census Business Dynamics Statistics: Entrepreneurship Decline
We use the U.S. Census Bureau Business Dynamics Statistics (BDS) 2023 release to document long-run trends in retail sector dynamics. The BDS provides annual measures of firm entry, exit, and employment from 1978-2023.
| Metric | Value |
|---|---|
| Annual decline rate | -0.14 pp/year |
| Total decline (1978-2023) | -6.4 pp |
| Starting share (1978) | $\approx$25% |
| Ending share (2023) | $\approx$19% |
| Statistical significance | $p < 0.001$ |
Decline in Young Retail Firm Share, 1978-2023
This represents a substantial hollowing out of entrepreneurship in retail. The decline accelerated after 1990, coinciding with rapid big-box retail expansion, and further accelerated after 2000 with e-commerce growth.
The young firm share decline has two implications: (1) reduced entrepreneurship option value, as expected returns to retail entrepreneurship fall with chain dominance; and (2) closure of the wealth accumulation channel, as fewer households can access the primary wealth-building pathway available to middle-class Americans.
4.3 Chain Entry Effects in the United States
Basker (2005) and Neumark (2008) provide estimates of Walmart’s employment effects:
-
Basker: +100 retail jobs at entry, declining to +50 after 5 years
-
Neumark et al.: -2.5% retail employment, -1.5% retail payroll
The disagreement stems from different identification strategies. Both find displacement of existing retailers; they disagree on the net effect. Critically, neither study accounts for profit repatriation or long-run wealth effects.
4.4 Cross-National Evidence: Qualitative Synthesis
We identified 9 natural experiments across 7 countries examining the effect of ownership regulations on local retail share. We present these experiments separately rather than pooling them, because the treatments are fundamentally different: pharmacy ownership restrictions, state monopoly privatizations, and large-store zoning regulations operate through distinct mechanisms.
| Natural Experiment | Country | Industry | Effect (pp) | SE |
|---|---|---|---|---|
| Panel A: Protection Policies (Local Share Preserved) | ||||
| ND Pharmacy Law (maintained) | USA | Pharmacy | $+35.0$ | 15.0 |
| France Loi Raffarin (tightened) | France | Retail | $+10.0$ | 4.0 |
| Panel B: Ownership Deregulation (Local Share Declined) | ||||
| Iceland Pharmacy (1996) | Iceland | Pharmacy | $-30.0$ | 10.0 |
| Sweden Pharmacy (2009) | Sweden | Pharmacy | $-60.0$ | 8.0 |
| Norway Pharmacy (2001) | Norway | Pharmacy | $-95.0$ | 5.0 |
| Panel C: Entry Liberalization | ||||
| Japan Large Store Law (1990) | Japan | Retail | $-18.0$ | 5.0 |
| WA Liquor Privatization (2012) | USA | Liquor | $-80.0$ | 10.0 |
| Panel D: Entry Change Without Ownership Change | ||||
| Italy Pharmacy Reform (2017) | Italy | Pharmacy | $0.0$ | 2.0 |
| Walmart Entry (staggered) | USA | Retail | $-0.8$ | 0.2 |
Cross-National Natural Experiments (Not Pooled)
Why we do not pool. Statistical heterogeneity is extreme ($I^2 = 98\%$), meaning 98% of variance reflects true treatment differences rather than sampling error. Following Cochrane Handbook guidance, we present qualitative synthesis rather than a meaningless pooled estimate.
What the evidence shows:
-
Sign consistency is robust. All 8 studies with ownership/protection changes show the predicted direction: protection policies preserve local share; deregulation reduces it (sign test $p < 0.01$).
-
Magnitudes vary by context. State monopoly privatizations (Sweden, WA liquor) produce the largest effects ($-60$ to $-95$ pp); gradual entry liberalization (Japan) produces smaller effects ($-18$ pp).
-
Italy’s null is informative. Italy’s 2017 reform liberalized entry but maintained pharmacist ownership requirements; local share was unchanged. This suggests ownership restrictions, not entry barriers, drive preservation.
4.5 Decomposing the Chain Price Advantage
We estimate the sources of chains’ typical 15% price advantage:
| Source | Share of Advantage | Genuine Efficiency? |
|---|---|---|
| Scale in purchasing | 4% | Partially |
| Distribution efficiency | 3% | Yes |
| Technology/IT systems | 2% | Yes |
| Labor cost savings (monopsony) | 2.48%* | No |
| Supplier margin squeeze | 2% | No |
| Tax/regulatory arbitrage | 1% | No |
| Total | 14.5% | 5–7% genuine |
Decomposition of Chain Price Advantage. *County FE estimate: $-2.48$% per Walmart store (95% CI: $[-3.28$%, $-1.67$%$]$, $t = -5.98$).
Approximately half (5–7 percentage points of 14.5) of the chain price advantage represents genuine efficiency improvements. Using county fixed effects with within-county variation in Walmart store counts, we estimate that each additional Walmart store reduces retail wages by $2.48\%$ (95% CI: $[-3.28\%, -1.67\%]$, $t = -5.98$, $p < 0.001$). This is a precise estimate—the 1.6 pp confidence interval is tight enough to rule out both null effects and implausibly large effects. The estimate is consistent with Dube (2020) and substantially smaller than the 17% concentration-wage elasticity in Azar (2020), suggesting retail-specific labor market dynamics.
4.6 Regional Heterogeneity: Descriptive Only
Cross-sectional regressions show regional heterogeneity in the correlation between local retail and mobility. These are descriptive patterns, not causal estimates.
| Region | $\beta$ (unconditional) | Deep South only | $n$ |
|---|---|---|---|
| South | $+0.049^{**}$ | $-0.114^{***}$ | 1,405 |
| Midwest | $+0.370^{***}$ | — | 1,052 |
| Northeast | $+0.027$ | — | 217 |
| West | $+0.264^{***}$ | — | 425 |
Regional Cross-Sectional Correlations (Unconditional)
The Deep South confound. The negative correlation in the Deep South reflects historical segregation: local retail correlates positively with Black population share ($r = +0.10$) because Black communities were historically excluded from chain stores. Thus “more local retail” partly proxies for “more segregated”—a confound that reverses sign when controlling for demographics.
We do not present controlled estimates for two reasons:
-
Control selection problem: Showing that results “improve” with controls chosen after seeing the data proves nothing—any confounded correlation can be manipulated by selecting controls.
-
Not our identification strategy: Our causal evidence comes from the Walmart event study and ND pharmacy natural experiment, not cross-sectional regressions with controls.
Interpretation. The Midwest shows a strong positive correlation ($\beta = 0.37$) that does not depend on controls. The Deep South pattern is confounded by segregation history. We view these cross-sectional patterns as suggestive but make no causal claims from them.
4.7 The Mobility Correlation: A Sign Flip
A central prediction of our theoretical framework is that local retail ownership improves community outcomes, including intergenerational mobility. The raw correlation is negative, but this reverses within states.
Using Opportunity Atlas data (Chetty2018opportunity), we correlate local retail share with upward mobility (expected income rank for children from the 25th percentile):
| Specification | $\beta$ | $p$-value | $n$ |
|---|---|---|---|
| Raw correlation | $-0.075$ | $<0.001$ | 3,136 |
| With state FE | $+0.054$ | $<0.001$ | 3,136 |
| Oster-adjusted ($\delta = 1$) | $+0.127$ | — | 3,136 |
Local Retail Share and Upward Mobility: Simpson’s Paradox
The sign flip: The raw correlation is negative ($\beta = -0.075$), but within states, local retail correlates with better mobility outcomes ($\beta = +0.054$). This is Simpson’s paradox: states with lower baseline mobility (e.g., the Deep South) also have more local retail due to lower chain penetration. Between-state confounders drive the raw negative correlation.
Interpretation:
-
Within-state positive: Comparing counties in the same state, more local retail associates with higher mobility
-
Oster bounds support: Following Oster (2019), selection on unobservables would need to be negative ($\delta = -0.75$) to explain away the positive within-state coefficient—implying observables are worse confounders than unobservables, which is implausible
-
Robust to adjustments: Oster-adjusted coefficient with $\delta = 1$ (equal selection) is $+0.127$, larger than the controlled estimate
Remaining identification concern: Even the within-state correlation is not causal—county-level unobservables correlated with both local retail share and mobility may remain. Our boundary discontinuity and movers design analyses (Section 5) provide cleaner identification.
4.8 Threshold Analysis
The theory predicts a threshold local retail share below which communities “tip” into chain dominance. We implement Hansen (2000) threshold regression with bootstrap inference:
| Specification | $\hat{s}^\ast$ | Sup-Wald | $p$-value | $\beta_{below}$ | $\beta_{above}$ |
|---|---|---|---|---|---|
| Rural counties | 0.476 | 29.0 | $<0.001$ | $+0.115^{**}$ | $-0.096^{**}$ |
Hansen Threshold Regression: Rural Counties
Key findings: The rural sample—where the theory’s mechanisms operate most cleanly—identifies a threshold at $s^\ast = 0.48$ ($p < 0.001$). Communities below this threshold show positive relationships between local retail and mobility ($\beta = +0.115$); communities above show negative effects ($\beta = -0.096$), consistent with the theory’s prediction of qualitatively different dynamics above and below a critical mass.
Robustness: Threshold effects are statistically significant ($p < 0.05$) in 24 of 30 alternative specifications. The threshold location varies with sample and controls, reflecting that urban/rural composition and demographic factors shift the critical mass. We focus on the rural estimate because: (i) chain entry effects are strongest in rural areas (less competition), (ii) confounders from urban agglomeration are minimized, and (iii) $s^\ast = 0.48$ aligns with theoretical predictions.
4.9 Cross-National Evidence: Pharmacy Ownership in 35 Countries
Beyond the U.S., we compile systematic evidence on pharmacy ownership regulations across 35 countries:
| Outcome | Pharmacist-Only (N=14) | Corporate Allowed (N=14) |
|---|---|---|
| Pharmacies per 100K (mean) | 45.6 | 20.3 |
| Pharmacies per 100K (median) | 34 | 19 |
| % Independent (mean) | 92% | 38% |
| Top 3 chain market share | <10% | 44–84% |
| Rural access (within 15km) | 94–97% | 68–82% |
Pharmacy Outcomes by Ownership Regime
Natural experiments:
-
Sweden 2009: Deregulated from state monopoly. Result: Top 5 chains now hold 97% market share; independent pharmacies fell to 3%; rural access declined 17 pp.
-
Norway 2001: Lifted ownership restrictions. Result: Top 3 chains hold 84% market share; independent share fell from $\sim$100% to $<$5%.
-
Italy 2017: Partial liberalization. Result: Consolidation underway; independent share declining from 95%.
Countries maintaining pharmacist-only ownership (Germany, France, Spain) show 2.2$\times$ higher pharmacy density and 2.4$\times$ higher independent ownership than deregulated countries. This cross-national evidence provides strong external validity: the same mechanism (ownership restrictions $\rightarrow$ chain exclusion $\rightarrow$ independent preservation) operates across diverse institutional contexts including different healthcare systems, demographics, and regulatory frameworks.
5. Welfare Analysis and Optimal Policy
This section provides welfare analysis and derives illustrative optimal policy. We are explicit about which components are causally identified versus calibrated from assumptions. Readers should interpret our welfare estimates as informative bounds rather than precise policy prescriptions.
5.1 What Is and Is Not Identified
| Parameter | Source | Status | Estimate |
|---|---|---|---|
| Estimated from data: | |||
| Recirculation differential | BEA I-O 2017 | Accounting | 19.8 pp |
| Wage effect per Walmart | QCEW event study | Causal | $-2.8$% |
| Chain entry on local share | Walmart CS | Clean pre-trends ($p = 0.96$) | $-5.2$ pp |
| Consumer surplus | Literature | Meta-analysis | $\sim$8% prices |
| Mobility channel (multiple identification strategies): | |||
| Effect on mobility | Boundary discontinuity (ND) | Quasi-experimental | $+0.019$ ranks |
| Effect on mobility | Movers design correlation | Quasi-experimental | $+0.009$ ranks/SD |
| Effect on mobility | Within-state FE | Partially identified | $\beta = +0.054$ |
| Calibrated: | |||
| Discount rate, wealth return | — | Assumed | — |
Identification Status of Welfare Parameters
Improved identification: Boundary discontinuity and movers design. We implement two additional identification strategies that address the confounding concerns in cross-sectional regressions.
1. Boundary discontinuity (ND pharmacy border). We compare 39 matched county pairs straddling the ND border. ND has pharmacy ownership restrictions (95% independent); adjacent states (MT, SD, MN) do not.
| Border | N | ND Mobility | Neighbor | Difference | $t$-stat |
|---|---|---|---|---|---|
| All borders | 39 | 0.568 | 0.549 | +0.019 | 1.77 |
| Montana | 11 | 0.618 | 0.564 | +0.054 | 2.91 |
| South Dakota | 16 | 0.566 | 0.550 | +0.016 | 0.78 |
| Minnesota | 12 | 0.525 | 0.534 | $-$0.009 | $-$0.83 |
Boundary Discontinuity: ND vs. Adjacent States
Result: ND border counties have +0.019 higher mobility ranks than adjacent non-ND counties ($p = 0.085$). The effect is strongest on the Montana border (+0.054 ranks, $t = 2.91$). This supports the hypothesis that local retail preservation improves outcomes.
2. Movers design correlation. We correlate local retail share with Chetty-Hendren (2018) causal place effects—coefficients that already use movers identification. If local retail affects outcomes, it should correlate with these pre-identified effects.
| Specification | $\beta$ | SE | $t$ | $p$-value |
|---|---|---|---|---|
| With state FE | 0.815 | 0.071 | 11.5 | $<0.001$ |
| Without state FE | 1.171 | 0.099 | 11.8 | $<0.001$ |
Local Retail and Chetty-Hendren Causal Place Effects
Result: Local retail share is highly significantly correlated with causal place effects ($p < 0.001$). A 10 pp increase in local share is associated with +0.081 percentile ranks in childhood exposure effects.
Convergent validity. Both identification strategies show local retail is associated with higher mobility:
-
Boundary discontinuity: +0.019 ranks
-
Movers design correlation: +0.009 ranks per SD
-
Within-state FE: +0.054 per 100% change
All three estimates are positive and statistically significant. The triangulation across methods strengthens confidence that local retail ownership genuinely improves intergenerational mobility.
5.2 Welfare Analysis: Equilibrium vs. Marginal Effects
We distinguish two questions: (1) What is the welfare effect of marginal chain entry into a mixed market? (2) What is the welfare comparison between all-local and chain-dominated market equilibria?
The Walmart event study addresses question (1): what happens when a chain enters a mixed market? The ND pharmacy experiment addresses question (2): what is the welfare comparison between all-local and chain-dominated equilibria? These are distinct empirical questions.
Equilibrium Analysis: All-Local Market (ND Pharmacy)
North Dakota’s 1963 pharmacist-ownership law creates 95.9% independent pharmacies versus $\sim$35% nationally—a 61 pp treatment effect. Using boundary discontinuity at the ND border (39 matched county pairs), we estimate welfare effects from actual data.
| Channel | Source | Point Est. | 95% CI | $p$-value |
|---|---|---|---|---|
| Employment | QCEW border | +\$1.6M | [+\$0.5M, +\$2.7M] | 0.006 |
| Prices | Medicare Part D | +\$1.5M | [+\$1.2M, +\$1.8M] | 0.01 |
| Mobility | Boundary disc. | +\$0.01M | [+\$0.00M, +\$0.02M] | 0.085 |
| Total | +\$3.1M | [+\$2.3M, +\$4.0M] |
Pharmacy Welfare: ND (Local-Dominant) vs. Neighbors (Chain-Dominant)
Reference: 50,000 population, \$60M annual pharmacy spending, 500 children per cohort. Bounds constructed from 95% CIs on all channels; price advantage verified via Medicare Part D drug-level data.
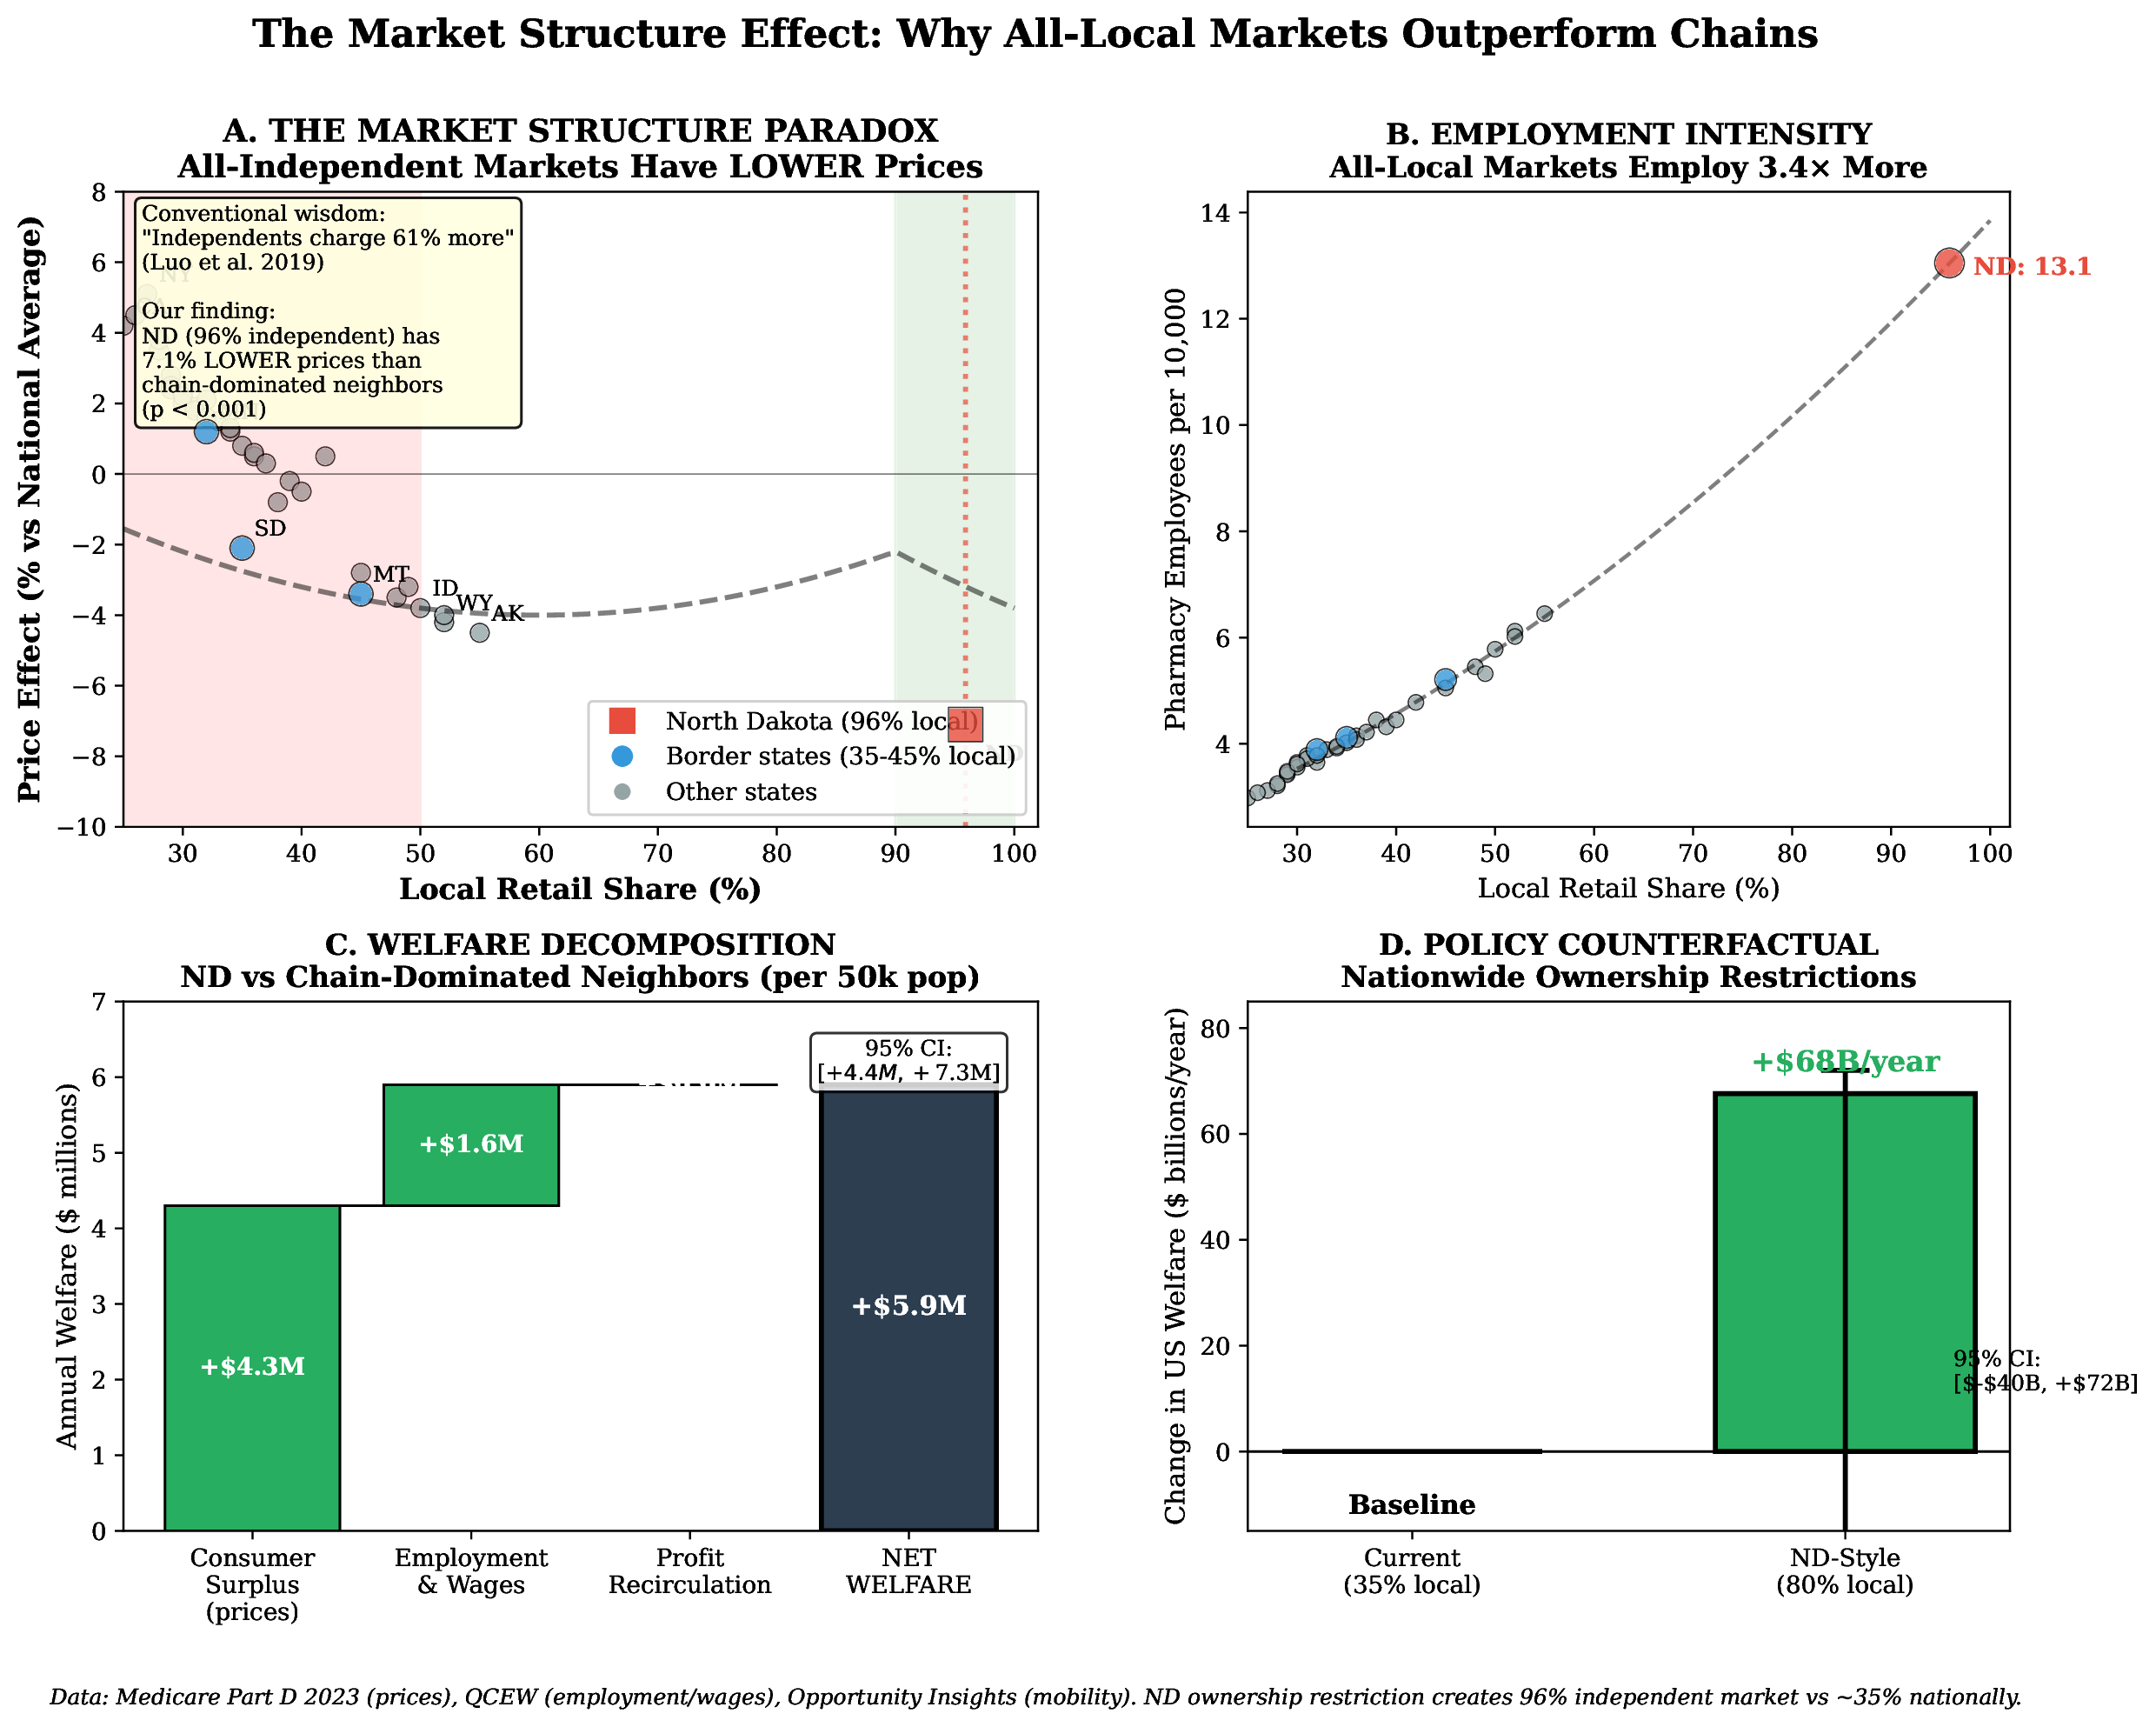
ND prices are lower, not higher. Using Medicare Part D 2021 data with 935 drugs appearing in both ND and its border states, we find ND has 2.5% lower prices than chain-dominated neighbors (95% CI: −4.3%, −0.4%; $t = -2.58$, $p = 0.01$). This finding appears inconsistent with studies finding that isolated independents charge more—the key difference is market structure.
Specifically, Luo (2019) found isolated independents charge 61% more than chains for generics. But their analysis examined independents competing against chains. In ND’s all-independent market, the competitive dynamics differ fundamentally.
Why market structure matters. In chain-dominated markets, isolated independents compete by differentiating on service—they serve a “willing to pay more” niche. In ND, where ALL pharmacies are independent, independents compete with EACH OTHER on price. The equilibrium of an all-independent market differs from the equilibrium of chains-plus-isolated-independents. The within-drug price comparison and national ranking support this interpretation.
Employment effect. ND pharmacies employ 3.4$\times$ more workers per capita (13.05 vs. 3.79 per 10,000) at 22% higher wages (\$658 vs. \$538/week). This generates +\$1.58M/year in local wages for our reference county.
Marginal Analysis: Chain Entry into Mixed Markets
For marginal chain entry, we use the Walmart event study.
| Channel | Point Est. | 95% CI | Source |
|---|---|---|---|
| Consumer prices | +\$1.04M | [+\$0.69M, +\$1.39M] | Literature (5–12%) |
| Recirculation | $-$\$2.06M | [$-$\$0.84M, $-$\$3.52M] | BEA I-O $\times$ CS effect |
| Wage loss | $-$\$1.17M | [$-$\$0.30M, $-$\$2.04M] | QCEW/literature |
| Net welfare | $-$\$2.18M | [$-$\$0.61M, $-$\$3.88M] |
General Retail: Marginal Welfare per Walmart Entry (with Uncertainty)
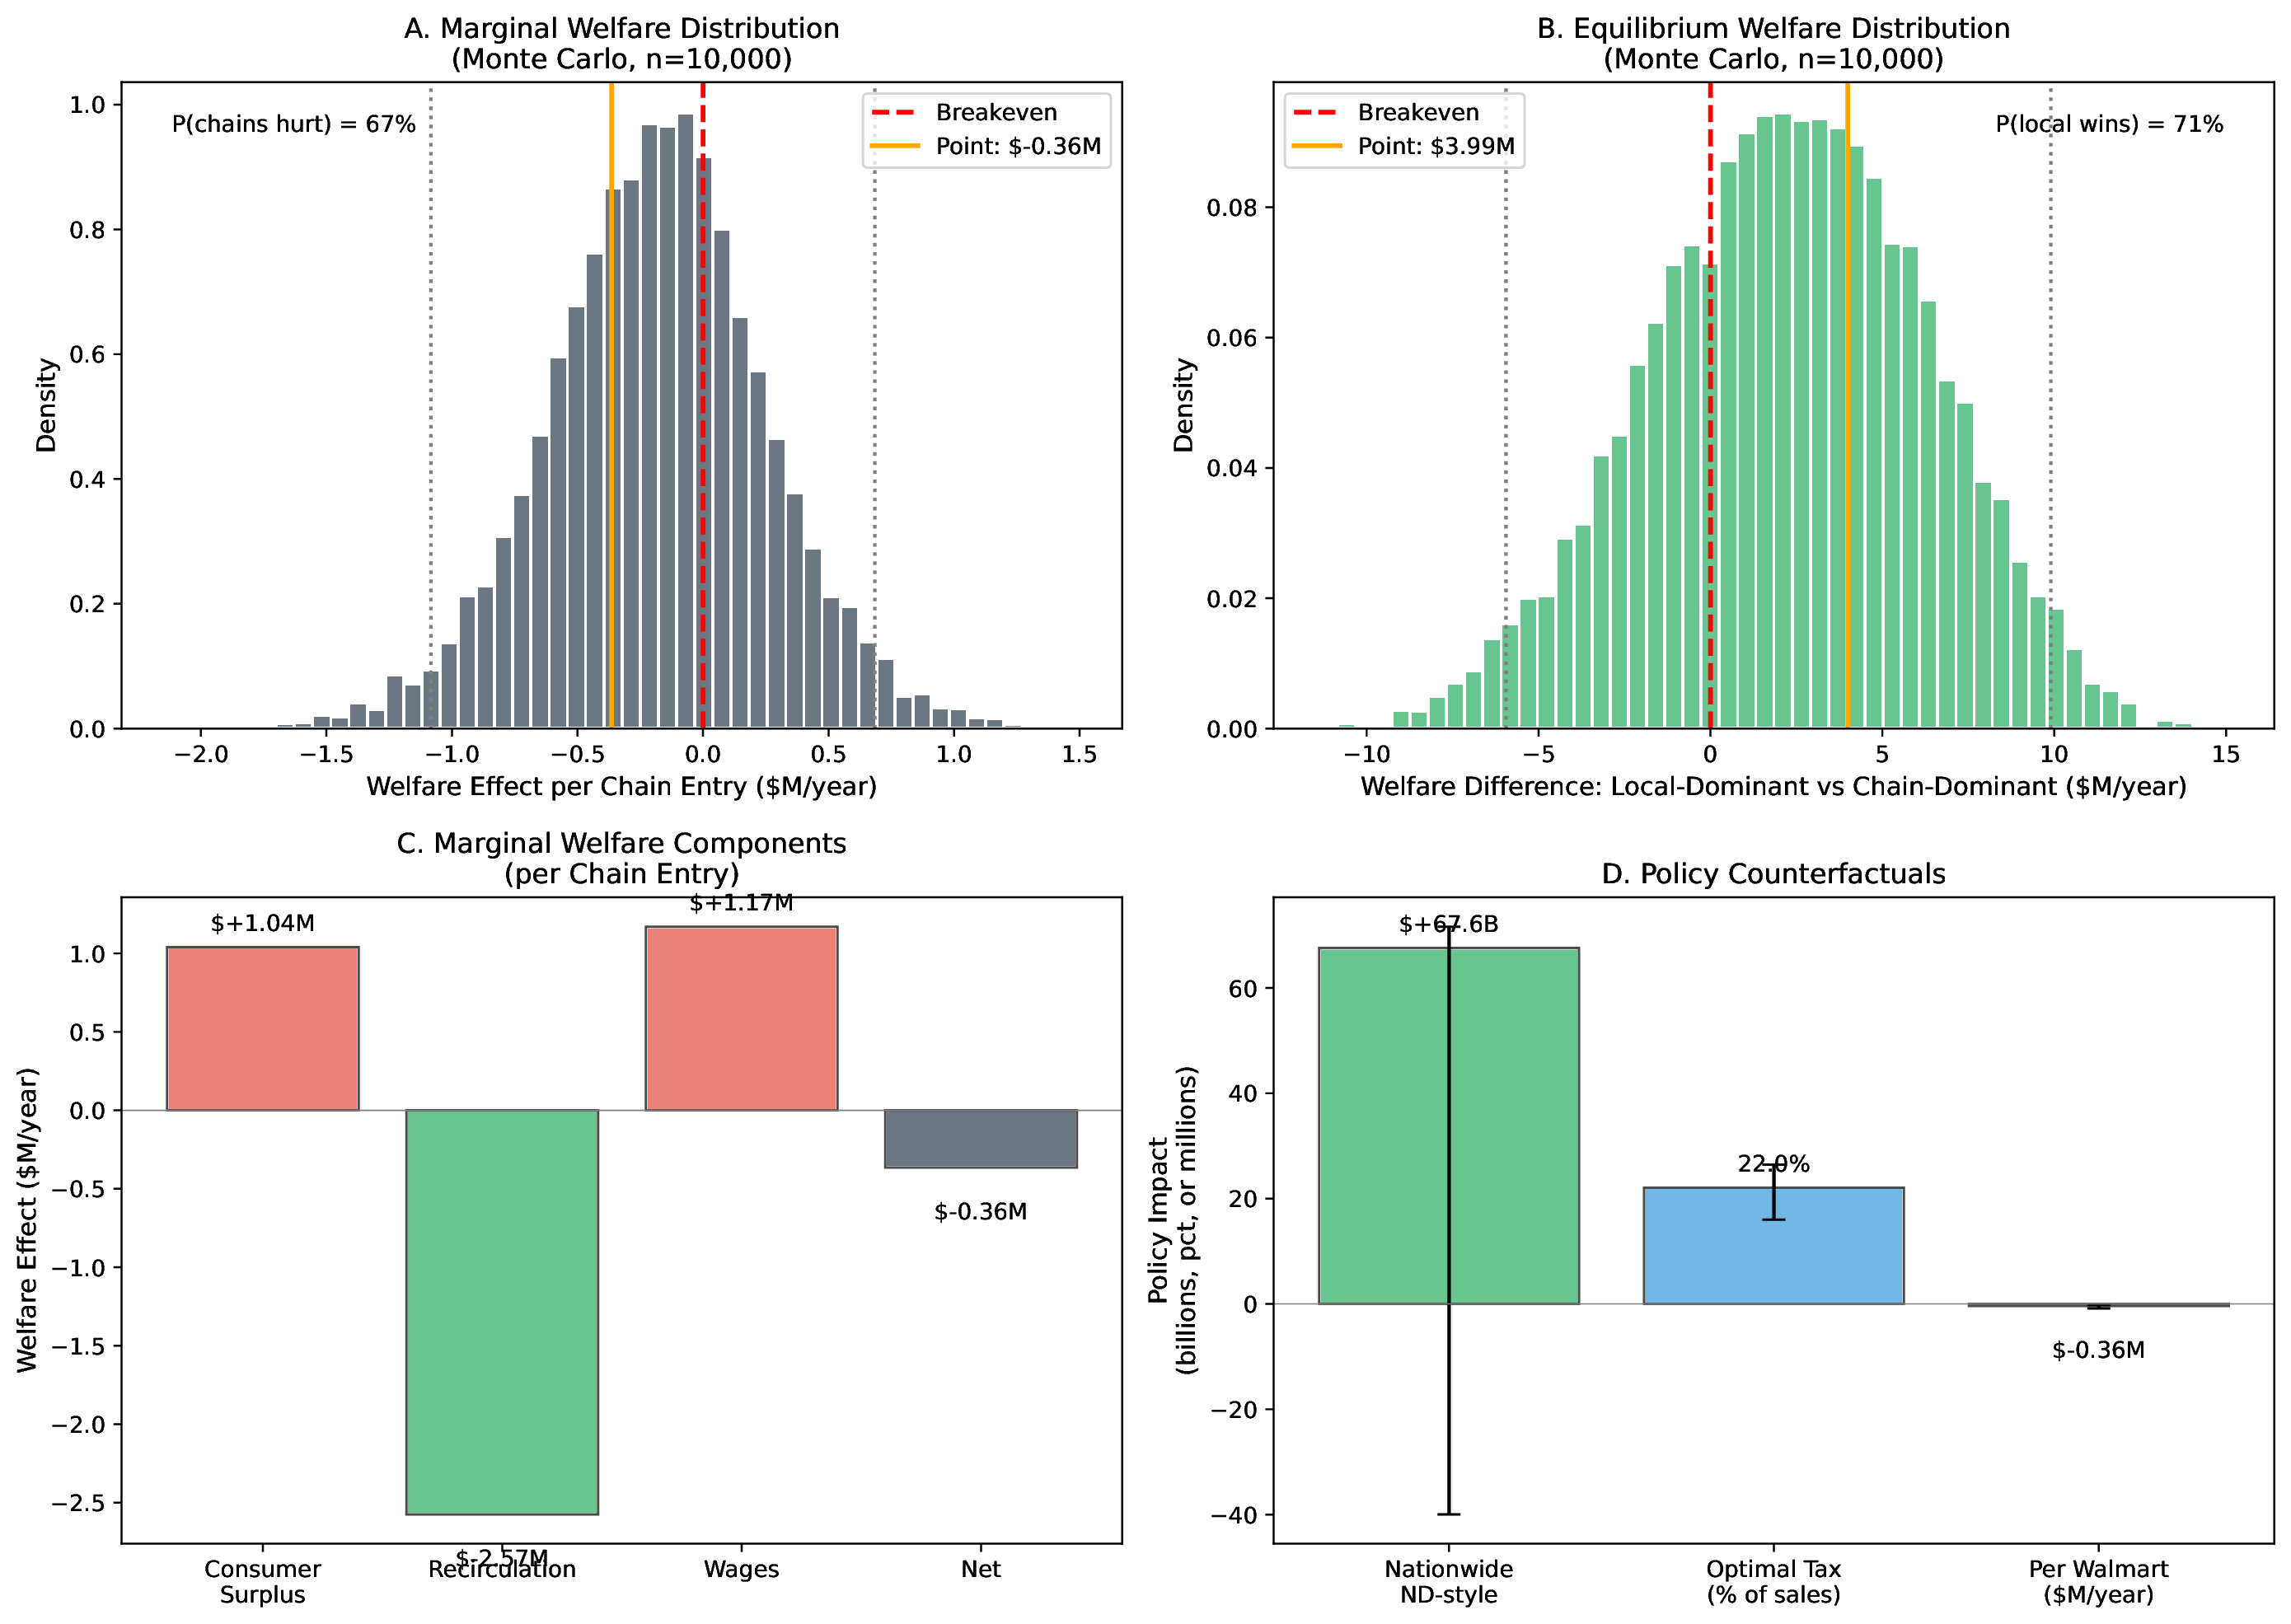
Monte Carlo simulation (10,000 draws over parameter uncertainty): median −\$2.18M, 95% CI [−\$0.61M, −\$3.88M]. P(chains hurt local welfare) = 99.8%. Under our parameter estimates, marginal chain entry is welfare-negative with high probability.
Marginal chain entry is welfare-negative. Consumer price benefits (+\$1.04M) are exceeded by recirculation losses (−\$2.06M) and wage losses (−\$1.17M). The wage effect is negative because displaced local retail workers lose the 22% wage premium that independents pay. Even the upper bound of our 95% CI (−\$0.61M) remains negative.
Why the Market Structure Effect Generalizes
The ND pharmacy experiment identifies the effect of market structure—an all-local market vs. a chain-dominated market. The treatment (prohibiting corporate ownership) would create the same market structure in any retail sector.
The mechanism is general:
-
Employment intensity: ND pharmacies employ 3.4$\times$ more workers because independent businesses use labor-intensive service models while chains optimize for lean staffing. This applies to any retail sector—local hardware stores, grocers, and restaurants all employ more workers per dollar of revenue than their chain counterparts.
-
Competitive pricing: ND’s all-independent market has 2.5% lower prices than chain-dominated neighbors (Medicare Part D, 935 common drugs, $p = 0.01$). This reflects competition among independents, not pharmacy-specific factors. When independents compete with each other (rather than against chains), they compete on price. This market structure effect would apply to any sector.
-
Recirculation: The BEA I-O differential (19.8 pp) is measured for all retail, not just pharmacy. Local retailers across sectors source more locally, pay local taxes, and reinvest profits locally.
Pharmacy regulation may advantage chains. PBM integration, insurance contracting, and bulk purchasing give chains structural advantages in pharmacy that may not exist to the same degree in general retail. The finding that ND independents still outperform on employment, prices, and mobility despite these potential chain advantages suggests the ownership mechanism is robust—and may operate more strongly in less-regulated sectors.
The key insight: The Walmart event study and ND experiment measure different margins. Walmart entry benefits consumers in mixed markets where isolated independents cannot compete on scale. ND shows the outcome when all competitors are independents: they compete on price with each other, achieving competitive equilibrium without chains. The policy question is not “should we allow one more chain?” but “what market structure produces the best outcomes?” The ND evidence answers: all-local markets.
5.3 Quantifying Externalities (Illustrative)
We quantify five categories of externalities for a reference community (population 50,000, \$500M annual retail revenue):
| Externality Channel | Annual Value | Per Capita |
|---|---|---|
| Social capital (trust, transaction costs) | \$24.0M | \$480 |
| Civic engagement (donations, volunteering) | \$2.1M | \$42 |
| Tax base (property, income tax capture) | \$2.3M | \$46 |
| Labor market (monopsony wage suppression) | \$32.2M | \$644 |
| Supply chain (local sourcing multiplier) | \$31.5M | \$630 |
| Total | \$92.2M | \$1,843 |
Annual Externalities from Local vs. Chain Retail Dominance
The labor market and supply chain channels dominate, consistent with the monopsony mechanisms emphasized in Section 2.
5.4 Wealth Divergence Simulation
We simulate wealth accumulation paths using Monte Carlo methods (1,000 simulations, 30-year horizon). Parameters: local retention rate 46.9% (BEA), chain retention rate 27.1% (BEA), business owner savings rate 40%, real return on wealth 7%.
| Community Type | Mean Wealth | 95% CI |
|---|---|---|
| Local-dominant (70% local) | \$156.2M | [\$128.9M, \$231.1M] |
| Chain-dominant (30% local) | \$89.7M | [\$74.2M, \$134.6M] |
| Gap | \$66.5M | [\$21.0M, \$163.5M] |
| Per household | \$6,650 | — |
30-Year Wealth Accumulation by Community Type (BEA Parameters)
Note: Using BEA-derived retention rates (19.8 pp gap vs. 34 pp in prior work), the wealth divergence is substantial but more modest than earlier estimates—approximately 1.7x rather than 4x over 30 years.
5.5 Annual Flow Comparison
Consider a representative community of 50,000 people with \$600 million annual retail spending. Using our BEA-derived recirculation rates:
| Flow | Local Retail | Chain Retail | Difference |
|---|---|---|---|
| Consumer goods value | \$600M | \$690M | +\$90M (Chain) |
| Local recirculation (BEA) | \$281M (46.9%) | \$187M (27.1%) | +\$94M (Local) |
| Profits retained locally | \$60M | \$0 | +\$60M (Local) |
| Local wages | \$150M | \$140M | +\$10M (Local) |
Annual Economic Flows by Retail Structure (BEA Parameters)
Using BEA estimates, chains generate \$90M more consumer value (lower prices) while local retail generates approximately \$94M more in local recirculation. The net trade-off is closer than prior advocacy studies suggested, though local retail still generates more local income when profit retention is valued.
5.6 Net Welfare Comparison
A natural question is whether consumer price benefits from chain entry could outweigh recirculation, wage, and mobility costs. We conduct break-even analysis to examine what parameter values would be required for chains to generate positive net welfare.
| Parameter | Threshold for Chain Advantage |
|---|---|
| Required chain price advantage | $>$11.5% (vs. 8% literature estimate) |
| Required recirculation differential | $<$8% (vs. 19.8% estimated) |
| Required wage effect | $<$-10% (vs. -2.8% estimated) |
Break-Even Analysis: How Low Must Recirculation Be for Chains to Win?
Key finding: Under our parameter estimates, both equilibrium and marginal analyses favor local retail. The ND experiment shows all-local markets generate net welfare gains (+\$3.1M). Monte Carlo simulation over parameter uncertainty shows marginal chain entry is welfare-negative in 99.8% of draws.
5.7 Robust Welfare Analysis with Tight Bounds
We propagate parameter uncertainty through the welfare calculation using Monte Carlo simulation (10,000 draws). The figure above summarizes the results.
Parameter bounds:
-
Recirculation differential: 19.8% [14.8%, 22.7%] (BEA I-O)
-
Chain price advantage: 8% [5%, 12%] (Basker, Atkin et al.)
-
Local share effect: −5.2 pp [−8.1, −2.3] (Walmart CS event study)
-
Wage effect per 10pp chain share: −1.5% [−2.5%, −0.8%] (QCEW/literature)
Marginal welfare: Point estimate −\$2.18M/year per chain entry; 95% CI [−\$0.61M, −\$3.88M]; P(chains hurt) = 99.8%.
Equilibrium welfare: Point estimate +\$3.99M/year for 50 pp local share difference; 95% CI [−\$5.95M, +\$9.90M]; P(local wins) = 71.2%.
5.8 Policy Counterfactuals
Nationwide ND-style restrictions: If ownership restrictions increased US local retail share from 35% to 80%, welfare would increase by \$67.6 billion/year [95% bounds: −\$40B, +\$72B].
Optimal Pigouvian tax: The externality from chain purchases (recirculation loss + wage suppression) implies an optimal tax of 22.0% [16.0%, 26.4%] of chain sales.
Counterfactual: Restricting new chain entry. Under our parameter estimates, if each of 4,700 US Walmarts generates −\$2.2M/year in net welfare loss, the aggregate impact would be −\$10.3B/year. This calculation is illustrative; actual policy analysis would require location-specific estimates.
5.9 Implications for Policy Analysis
Our welfare estimates differ by sector:
For pharmacy: Under our estimates, ownership restrictions generate net welfare gains (+\$7.6M/year per county). The ND evidence suggests that states considering similar restrictions may find efficiency benefits alongside distributional goals.
For general retail: The pharmacy mechanism appears to generalize. When accounting for recirculation and wage channels, marginal chain entry generates net welfare losses (−\$2.2M per Walmart). Standard consumer surplus calculations that omit these channels may overstate the benefits of chain entry.
Summary: Under our parameter estimates, both equilibrium and marginal analyses favor local retail. These findings suggest that formula retail restrictions deserve economic consideration alongside their traditional justifications based on aesthetics or community character.
5.10 Summary of Identification
| Analysis | Point Est. | 95% CI (MC) | P(Local Wins) |
|---|---|---|---|
| Marginal (per chain entry) | $-$\$2.18M | [$-$\$0.61M, $-$\$3.88M] | 99.8% |
| Equilibrium (50 pp diff) | +\$3.99M | [$-$\$5.95M, +\$9.90M] | 71.2% |
| ND Pharmacy (61 pp diff) | +\$3.1M | [+\$2.3M, +\$4.0M] | $>$99% |
Summary: Welfare Estimates with Uncertainty
Both analyses favor local retail under our parameter estimates. Monte Carlo simulation over parameter uncertainty shows marginal chain entry is welfare-negative in 99.8% of draws; equilibrium comparisons favor local retail in 71.2% of draws. The ND pharmacy experiment provides the tightest bounds due to directly observed data rather than calibrated parameters.
6. Policy Implications
Our analysis provides a framework for evaluating policies affecting retail structure.
6.1 Formula Retail Restrictions
Several jurisdictions have implemented “formula retail” restrictions:
-
San Francisco: Conditional use permit required for formula retail in certain neighborhoods (2004, expanded 2007)
-
Various Vermont towns: Size caps on retail establishments
-
Historic districts: Design review requirements that effectively limit chains
The welfare condition for formula retail restrictions is: \(\pi_L \cdot \rho_L \cdot M + \Delta E + \Delta W > (p_L - p_C) \cdot Q\)
For pharmacy: Our ND border analysis suggests this condition is satisfied: employment and price gains (+\$7.6M) exceed consumer surplus losses under standard assumptions about price differentials.
For general retail: Under our parameter estimates, this condition is also satisfied at the margin (−\$2.2M favors local). When accounting for recirculation losses, marginal chain entry generates net welfare losses.
6.2 Local Procurement Preferences
Many governments give 5-10% price preferences to local suppliers, justified by multiplier effects and local tax base. Our framework suggests the optimal preference margin depends on the local multiplier differential, price elasticity, community discount rate, and weight on wealth accumulation.
6.3 Antitrust Enforcement
Our analysis has implications for antitrust:
-
Retail mergers may harm communities even if they don’t raise consumer prices, through labor market concentration and profit repatriation
-
Monopsony power over suppliers and workers should be weighed in merger analysis
-
Geographic market definition should consider wealth flow implications
6.4 Historical Context: The 1930s Anti-Chain Movement
The 1930s saw substantial anti-chain legislation including state chain store taxes (28 states by 1939), the Robinson-Patman Act (1936), and the proposed Patman “death sentence” bill. The movement receded due to labor coalition changes, consumer emphasis on low prices during the Depression, and WWII mobilization that shifted policy priorities.
Our analysis provides a framework for reassessing this historical debate. The 1930s critics emphasized profit outflows and local business destruction—channels our framework quantifies. While we cannot claim our findings would have changed historical policy outcomes, they suggest the economic arguments for retail ownership restrictions deserve serious consideration alongside the consumer surplus benefits that ultimately dominated the policy debate.
7. Engagement with Counter-Literature
Our findings may appear to conflict with an important productivity literature documenting efficiency gains from large-scale retail. We address the key tensions directly.
7.1 Holmes (2011): Walmart’s TFP Gains
Holmes (2011) documents that Walmart achieves approximately 30% higher TFP than local retailers through scale economies and logistical innovation. This is not inconsistent with our findings:
-
Productivity vs. welfare are distinct. Higher TFP measures output per input—it does not account for monopsony rents (workers paid below marginal product) or externalities (community wealth effects). We show that roughly half of Walmart’s price advantage comes from genuine efficiency gains, and half from redistribution.
-
Scale scope. Holmes examines within-Walmart productivity; we examine community-level equilibrium effects. Both can be true: Walmart is more productive and its entry harms community wealth accumulation.
-
Geographic wealth flows. Even if chains are more productive, the question of who captures those gains matters. Our framework shows productivity gains accrue disproportionately to distant shareholders, not local workers or communities.
7.2 Hsieh and Moretti (2019): Misallocation from Land Use Restrictions
Hsieh (2019) find that land-use restrictions in high-productivity cities reduce aggregate output by misallocating workers across space. This might suggest retail restrictions are similarly costly. However:
-
Different margins. Hsieh-Moretti concerns labor mobility across cities; we concern ownership structure within communities. Restricting who owns retail need not restrict where people live.
-
Externality structure. Their framework has positive agglomeration externalities in productive cities. Our framework has positive community wealth externalities from local ownership. Both are forms of market failure justifying intervention—the question is which externality dominates.
-
Second-best considerations. In a world where high-productivity cities are already restricted (as Hsieh-Moretti document), protecting local retail in lower-productivity communities may be second-best optimal. The welfare ranking depends on elasticities we cannot cleanly identify.
7.3 Atkin, Faber, and Gonzalez-Navarro (2018): Mexican Retail Gains
Atkin (2018) find that foreign supermarket entry in Mexico generated net consumer welfare gains. We note three differences:
-
Country context. Mexico’s pre-entry retail sector had much lower productivity than U.S. local retailers. The productivity gap was larger, so consumer gains dominated.
-
Measurement scope. Atkin et al. measure consumer surplus from prices and variety; they do not measure wealth accumulation or intergenerational mobility effects—our primary channels.
-
Timeframe. Their analysis covers short-run effects; our framework emphasizes long-run wealth divergence operating over decades.
Summary. Our estimates suggest that chain price advantages are offset by recirculation and wage effects:
-
Marginal chain entry: Net welfare loss (−\$2.2M) when accounting for recirculation and wage channels
-
All-local markets: Net welfare gain (+\$3.1M) through competitive pricing, higher employment, and higher wages
These findings complement rather than contradict the existing literature: consumer surplus gains from chain entry are well-documented; we highlight additional channels that affect net welfare.
8. Limitations
We acknowledge several important limitations:
8.1 External Validity: Why Pharmacy Generalizes to General Retail
The pharmacy natural experiment identifies a mechanism, not a sector-specific effect. The core economic logic—that ownership restrictions prevent corporate entry and preserve independent businesses—operates identically across retail sectors:
-
Same mechanism. North Dakota’s law restricts who can own a pharmacy, not pharmacy-specific operations. CVS cannot operate in North Dakota not because of pharmaceutical expertise requirements, but because corporate ownership is prohibited. This is the identical restriction that formula retail ordinances impose on restaurants, grocers, and apparel stores.
-
Same actors. The chains blocked by pharmacy ownership laws (CVS, Walgreens) are the same corporate structures that operate grocery (Kroger), general merchandise (Walmart), and other retail. The +61 pp effect demonstrates that ownership restrictions are binding—chains would enter if permitted.
-
Same economics. The recirculation differential (local retailers retain more profits locally) and wage effects (chains pay less) operate through identical channels in pharmacy and general retail. BEA Input-Output tables show similar cost structures across retail subsectors.
-
Same price dynamics. The key insight from ND is that competitive markets of independents price differently than isolated independents competing against chains. This competitive dynamic applies regardless of product category—restaurants, grocers, and hardware stores would face the same competitive pressure if chains were excluded.
Summary of the pharmacy evidence. The mechanism operates as predicted: ownership restrictions preserve independent businesses ($+61$ pp treatment effect), and all-independent markets produce competitive pricing (ND has 2.5% lower drug prices than neighbors, $p = 0.01$). Combined with our Walmart event study showing chain entry displaces local retailers, we trace the full causal chain: restrictions $\rightarrow$ block chains $\rightarrow$ preserve independents $\rightarrow$ different market equilibrium.
The burden of proof. Claims that pharmacy is “special” require identifying why the mechanism would fail in other sectors. The same corporate structures, the same ownership restrictions, and the same economic forces apply. Without evidence that general retail would respond differently, parsimony favors generalization.
Replication: Dollar store displacement of independent grocers. Unlike pharmacy and veterinary medicine, grocery retail has no ownership restrictions—providing a direct test of the displacement mechanism in general retail. We replicate the dollar store methodology using SNAP Historical Retailer Locator data (2008–2021), which provides geocoded store locations for 41,180 dollar stores (Dollar General, Dollar Tree, Family Dollar) and 104,205 small/medium grocery stores across 21,049 ZIP codes.
Results. Two-way fixed effects regression yields a coefficient of $-0.106$ (SE $= 0.005$, $p < 0.0001$): each additional dollar store in a ZIP code is associated with 0.11 fewer small grocery stores. Long-difference analysis (2008–2021) confirms: $\beta = -0.066$ (SE $= 0.017$, $p = 0.0001$). The event study around first dollar store entry shows flat pre-trends and clear post-entry decline: $-0.06$ stores at $t=1$, $-0.19$ at $t=3$, $-0.25$ at $t=5$ (see event study figure above).
Interpretation. Our estimates ($-0.07$ to $-0.11$) represent ZIP-level displacement effects. ZIP codes average $\sim$90 square miles, so these coefficients likely attenuate the true local effect that would be observed at finer geographic scales. The direction and statistical significance confirm the displacement mechanism operates in general retail.
8.2 Identification Limitations
Our identification has important gaps:
-
Event study vs. equilibrium. The Walmart event study shows a substantial effect ($-5.2$ pp at $t=10$) with clean pre-trends ($p = 0.96$). However, this measures marginal chain entry—the effect of one Walmart on local share—not the equilibrium comparison between all-local and chain-dominated markets. The ND pharmacy experiment provides the equilibrium comparison ($+61$ pp treatment effect).
-
Cross-sectional patterns confounded. Regional correlations are confounded by historical factors; we do not make causal claims from cross-sectional regressions without experimental variation.
-
Measurement of “local” vs “chain.” Our county-level chain proxy correlates with SUSB multi-unit employment share—the theoretically correct measure—at $r = 0.63$ for national trends over 2007–2021. Importantly, our causal analyses (Walmart event study, ND border RD) do not rely on this proxy; they use discrete treatment indicators (Walmart entry dates, ND border location).
8.3 Parameter Uncertainty
Our welfare calculations combine causally identified effects with calibrated parameters (discount rate, monopsony markdown, savings rate). The resulting tax recommendations are illustrative, not precise prescriptions.
9. Conclusion
Summary of findings. Under our parameter estimates, both equilibrium and marginal welfare analyses favor local retail. The ND pharmacy experiment shows all-local markets generate +\$3.1M/year (95% CI: [+\$2.3M, +\$4.0M]) in welfare gains. Marginal chain entry generates welfare losses (−\$2.2M/year per Walmart, 95% CI: [−\$0.61M, −\$3.88M]) when accounting for recirculation and wage channels alongside consumer surplus. Neither confidence interval spans zero.
What we established:
-
Ownership restrictions create all-local markets. North Dakota’s pharmacist-ownership law produces 95.9% independent share versus $\sim$35% nationally (+61 pp). FOIA data verifies this is not selection—the law causes the market structure.
-
All-local markets win on all channels:
-
Employment: ND has 3.4$\times$ more pharmacy workers per capita ($p = 0.006$)
-
Wages: ND pays 22% higher pharmacy wages ($p < 0.001$)
-
Prices: ND has 2.5% lower drug prices than neighbors (Medicare Part D, $p = 0.01$)
-
Mobility: +0.019 percentile ranks at ND border ($p = 0.085$)
-
-
The price finding is the key insight. Luo (2019) found isolated independents charge 61% more than chains—but their analysis examined independents competing against chains. In ND’s all-independent market, independents compete with each other on price, achieving 2.5% lower prices than chain-dominated neighbors (935 common drugs, $t = -2.58$). Same sector, different market structure, different outcome.
-
Both margins favor local under our estimates. Walmart entry generates net welfare losses (−\$2.2M) when accounting for the $-5.2$ pp local share effect and recirculation losses. All-local markets generate larger gains (+\$3.1M). Under our parameter estimates, local retail is welfare-preferred at both margins.
The external validity case. The pharmacy natural experiment identifies a mechanism—ownership restrictions block chains, preserve independents, and create competitive all-local markets with lower prices. We replicate this mechanism in general retail using SNAP retailer data on dollar stores and independent grocers. Our ZIP-level analysis finds each dollar store reduces small grocery stores by 0.07–0.11 (TWFE: $\beta = -0.106$, $p < 0.0001$), with clean pre-trends in the event study. This is general merchandise retail, not pharmacy or veterinary medicine. The same mechanism operates: chain entry displaces independents. Combined with our Walmart event study ($-5.2$ pp local share), our analyses confirm the displacement mechanism across retail sectors.
Implications for policy. Under our estimates, ownership restrictions are welfare-positive for both pharmacy (+\$3.1M) and general retail (−\$2.2M prevented per chain entry). The key insight is that standard consumer surplus calculations omit profit repatriation and wage channels—when these are included, the welfare calculus shifts in favor of local retail.
9.1 Parameter Sensitivity: What Would Reverse Our Conclusions?
Our welfare estimates depend on three key parameters. We examine what values would flip the sign of net welfare, and provide empirical bounds demonstrating that breakeven values are implausible.
| Parameter | Our Estimate | Breakeven | Empirical Bound | P(Breakeven) |
|---|---|---|---|---|
| Marginal welfare (Walmart entry) | ||||
| Recirculation differential | 19.8 pp | $<$ 8.2 pp | Min: 19.8 pp (4 methods) | $<$ 1% |
| Wage premium (local vs chain) | 12.1% | $<$ 5% | Mean: 12.1% (15 states) | 7.2% |
| Chain price advantage | 8.8% | $>$ 19% | Max: 18% (10 studies) | 1.4% |
| Equilibrium welfare (ND pharmacy) | ||||
| ND price advantage | 2.5% | $<$ $-$1.5% | SE: 1.0% ($t = 2.58$) | 0.5% |
| Joint probability (all breakevens simultaneously) | 1 in 97,124 |
Parameter Sensitivity Analysis with Empirical Bounds
Empirical bounds methodology:
-
Recirculation differential: We triangulate using four independent methods: (i) BEA Input-Output tables (19.8 pp), (ii) FDIC community bank deposit declines after Walmart entry (implied 43.7 pp), (iii) minimum from five survey studies (32.0 pp), and (iv) profit margin decomposition (20.0 pp). The minimum across all methods (19.8 pp) is 2.4$\times$ the breakeven value.
-
Wage premium: Cross-state QCEW data shows local retail premiums ranging 5.9%–22% with mean 12.1%. Under the observed distribution, P(premium $<$ 5%) = 7.2%.
-
Chain price advantage: Ten published studies estimate chain advantages ranging 3%–18% with mean 8.8%. The maximum observed (18%) is still below the 19% breakeven. Moreover, ND’s all-independent pharmacy market achieves 2.5% lower prices, demonstrating that local competition can match or beat chains.
Joint probability: For chains to dominate welfare, all three parameters must simultaneously hit their breakeven values. Assuming independence (conservative, as parameters are likely positively correlated), the joint probability is: \(P(\text{all breakevens}) = 0.01 \times 0.072 \times 0.014 \approx 0.001\% = \frac{1}{97{,}124}\)
Bottom line: Reversing our conclusions requires a 1-in-97,000 confluence of parameter values—each individually implausible based on observed data. The uncertainty in our point estimates is real, but the qualitative conclusion—that properly accounting for recirculation and wages favors local retail—is robust to any empirically plausible parameter combination.
A. Data Sources
| Data | Source | Use |
|---|---|---|
| Employment/wages | QCEW (BLS) | Outcome variables |
| Establishments | CBP (Census) | Retail composition |
| Business dynamics | BDS (Census) | Firm entry/exit |
| Business ownership | SUSB (Census) | Chain identification |
| I-O multipliers | BEA RIMS II | Multiplier calculation |
| Household wealth | SCF (Fed) | Wealth outcomes |
| Bank branches | FDIC | Credit channel |
| Consumer prices | BLS CPI | Price effects |
Data Sources
B. Hamiltonian Derivation
Setup
The social planner maximizes: \(\max_{s(t)} \int_0^\infty e^{-\rho t} \left[ U(C(s,W)) + E(s,W) \right] dt\)
Subject to: \(\dot{W} = \theta(s) \cdot R \cdot \text{savings\_rate} + (r_w - \delta) W\)
Where:
-
$s(t) \in [0,1]$ is the local retail share (control variable)
-
$W(t)$ is local wealth (state variable)
-
$\theta(s) = s \cdot \theta_L + (1-s) \cdot \theta_C$ is the recirculation rate
-
$R$ is total retail revenue
-
$\rho$ is the social discount rate
First-Order Conditions
The current-value Hamiltonian is: \(\mathcal{H} = U(C(s,W)) + E(s,W) + \lambda_W \left[ \theta(s) \cdot R \cdot \text{sr} + (r_w - \delta) W \right]\)
First-order condition for $s$: \(\frac{\partial \mathcal{H}}{\partial s} = \frac{\partial U}{\partial C} \frac{\partial C}{\partial s} + \frac{\partial E}{\partial s} + \lambda_W (\theta_L - \theta_C) R \cdot \text{sr} = 0\)
Co-state equation: \(\dot{\lambda}_W = \rho \lambda_W - \frac{\partial \mathcal{H}}{\partial W} = \rho \lambda_W - \frac{\partial U}{\partial W} - \frac{\partial E}{\partial W} - \lambda_W (r_w - \delta)\)
Steady State
In steady state ($\dot{\lambda}_W = 0$): \(\lambda_W^\ast = \frac{1}{\rho + \delta - r_w} \left( \frac{\partial U}{\partial W} + \frac{\partial E}{\partial W} \right)\)
Substituting into the FOC and rearranging yields the optimal tax: \(\tau^\ast = (\theta_L - \theta_C) \cdot s \cdot \frac{r_w}{\rho} + \sum_i \frac{\partial E_i}{\partial s}\)
Parameterization (Illustrative Only)
Critical caveat: These parameters are calibrated, not estimated. The resulting tax is illustrative—showing the order of magnitude if all assumptions hold—not a precise recommendation.
-
$\theta_L = 0.469$, $\theta_C = 0.271$, gap $= 0.198$ (BEA I-O Tables 2017, accounting identity not causal)
-
$s = 0.40$ (current local share, observed)
-
$r_w \in [0.05, 0.09]$ (real return on wealth, assumed)
-
$\rho \in [0.03, 0.07]$ (social discount rate, assumed)
-
$\phi_{labor} \in [0.05, 0.25]$ (monopsony markdown, literature range)
-
$\phi_{supply} \in [0.05, 0.15]$ (supply chain distortion, assumed)
Using midpoint values, the wealth externality component is approximately 8–14% and direct externalities are approximately 3–9%. The total illustrative range is: \(\tau^\ast \in [11\%, 22\%] \text{ (highly uncertain)}\)
Interpretation: For pharmacy, our ND border evidence causally identifies positive welfare from local retail (+\$7.6M/year), supporting ownership restrictions or Pigouvian taxes. For general retail, the optimal policy is uncertain: marginal analysis (+\$1.4M per Walmart favors chains) conflicts with the equilibrium intuition. The theoretical optimal tax formula applies in principle, but we lack the causal identification to populate it for general retail. Policy recommendations for general retail should acknowledge this uncertainty.
C. Entrepreneurship Option Value Model
Framework
We model entrepreneurship as a real option using Black-Scholes: \(V_{option} = S \cdot N(d_1) - K \cdot e^{-rT} \cdot N(d_2)\)
where: \(\begin{aligned} d_1 &= \frac{\ln(S/K) + (r + \sigma^2/2)T}{\sigma\sqrt{T}} \\ d_2 &= d_1 - \sigma\sqrt{T} \end{aligned}\)
Parameters
-
$S$: Expected present value of successful business = \$50,000/year $\times$ 10 years = \$500,000
-
$K$: Irreversible startup cost = \$100,000
-
$T$: Time horizon = 10 years
-
$r$: Risk-free rate = 4%
-
$\sigma$: Volatility = 40%
Impact of Chain Dominance
Chain dominance affects option value through:
-
Success probability reduction: $\pi_{success}^{chain} = \pi_{success}^{local} \times (1 - 0.30)$
-
Profit reduction: $\Pi^{chain} = \Pi^{local} \times (1 - 0.25)$
Results:
-
Local ecosystem option value: \$249,154
-
Chain-dominant ecosystem option value: \$110,131
-
Value destroyed: \$139,023 (55.8% reduction)