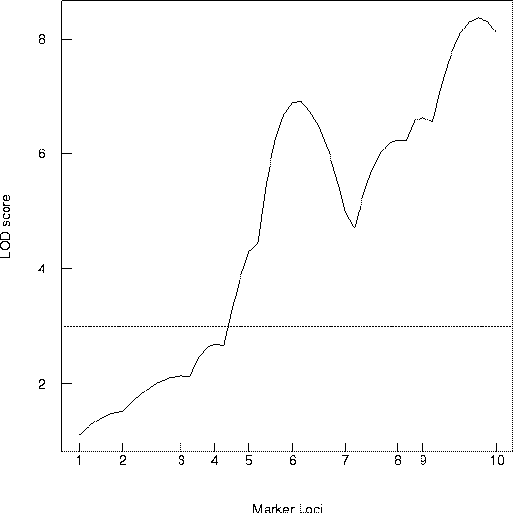
Figure 2: LOD Score across Linkage Group


One can draw inference about the presence of a QTL at a locus using the likelihood ratio statistic. By allowing the locus to range over the entire genome, one can test the null hypothesis of no QTL against the alternative of a major QTL. Human geneticists adopted the logarithm base 10 of the odds ratio, or LOD score, to test this hypothesis and to develop estimates of the locus [\protect\citeauthoryearOttOtt1991]. The LOD score is given by
LOD(locus) = log10 [ max like(locus) / max like(nolocus) ] ,
where the maximum is over the parameters of the linear model. The denominator is the likelihood under the null hypothesis of no QTL, the simple model of
trait = mean + error .
The numerator of the LOD score is the profile likelihood of the locus, maximizing the likelihood over the genotype effects at the presumed locus, given the linkage map. That is, one finds the best estimates of genotype effects for each locus, and calculates the resultant likelihood.

Figure 2: LOD Score across Linkage Group
The data on flowering time for the doubled haploid Brassica napus offspring were used with Mapmaker/QTL (Lander et al. 1987, Lander and Botstein 1989) to determine the LOD map shown in Figure 2. Notice the evidence for QTL near the 6th (WG6B10) and 10th (ACA1) marker, but keep in mind that this curve is based on fitting a single QTL model.
The most commonly used method to detect a QTL is the interval mapping approach [\protect\citeauthoryearLander and BotsteinLander and Botstein1989]. This method involves a scan across the genome, using an EM algorithm to iteratively maximize the profile likelihood at each putative locus. The algorithm was incorporated into the public domain computer program Mapmaker/QTL (Lander et al. 1987). More detailed developments of the EM algorithm for this problem can be found in luo:kear:1991, vano:1992 and chur:doer:1994b.
When the number of individuals is large, the maximum LOD score, at the estimated QTL locus, is proportional to (by dividing by k*2log(10)) an F value with numerator degrees of freedom k= the number of parameters per gene (k=1 for BC and DH breeding systems, k=2 for F2). Some packages use a chi-square approximation with k degrees of freedom (by dividing by 2log(10)) instead. One concludes there is no QTL if the maximum LOD is too small, usually LOD(locus)<3 in practice. An approximate confidence interval is constructed of all loci with LOD ``close'' to the maximum, usually within 1 unit. Darvasi et al. (1993) present simulations which suggest this works well if there are 200 to 500 offspring being studied. chur:doer:1994 argue that it would be better to use a permutation test (see next section) to determine p-values rather than relying on the F or chi-square approximations.
chur:doer:1994 describe an empirical approach to determine threshold values for interval analysis by using a permutation test. Phenotypic traits of the offspring in the experiment can be randomly permuted. If there is no QTL in an interval, then the maximum LOD computed with all random permutation of traits among offspring are equally likely. Thus one can estimate the p value by computing the maximum LOD score for many (say 1000) random permutations and find the rank of the observed maximum LOD among the permuted ones. chur:doer:1994 recommend 1000 random permutations at every location to obtain threshold value for the test at 5% level of significance. They state that permutation test provide a robust and powerful method of testing hypotheses, when the asymptotic distribution of the test statistic is unknown. This test has been incorporated into the QTLCart package [\protect\citeauthoryearZengZeng1994][\protect\citeauthoryearZengZeng1993].


