


The Markov chain Monte Carlo, or ``MCMC analysis'', considers the problem of estimating the joint likelihood,
like( loci, effects | traits, map ) ,
by using a Bayesian approach. Construct a Markov chain whose stationary distribution is this likelihood, and run a Monte Carlo simulation to draw inference about the polygene loci and effects. MCMC has been applied to ordering of markers on linkage maps [\protect\citeauthoryearStephens and SmithStephens and Smith1993] and pedigree analysis [\protect\citeauthoryearGeyer and ThompsonGeyer and Thompson1994][\protect\citeauthoryearThompsonThompson1991]. sata:yand:newt:osbo:1995 developed inference ideas for QTLs in plant breeding systems, with particular attention to doubled haploids.
The basic idea is as follows. First augment the likelihood to include the missing genotypes,
like( loci, effects, genos | traits, map ) .
The Markov chain successively updates the loci, effects and genotypes, conditioning on current values of the other unknowns. One can readily show that the updating probabilities for the loci are proportional to
prob( genos | loci, map ) * prob( loci | map ) ,
independent of traits and effects. The updating of effects depends only on the traits and genotypes. Finally, the updating probability of missing genotypes for each individual is proportional to
prob( trait | genos, effects ) * prob( genos | loci, map ) .
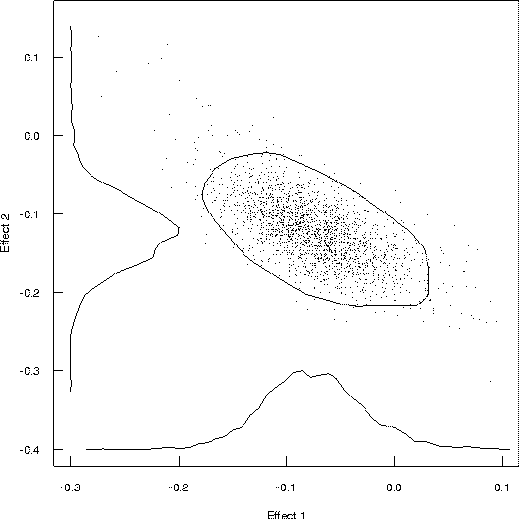
Figure 3: Estimated Joint Distribution of Two Gene Effects
Figure 3 shows the estimated joint distribution of effects for two putatitive QTL located near the markers examined earlier. Along each axis is a marginal histogram for the effect. In the middle is a scatter of the random sample drawn from the joint distribution using the Markov chain Monte Carlo method, as outlined below. The rough ellipse is a 90% confidence interval based on the high probability, similar in concept to confidence intervals computed in Mapmaker/QTL, except that these are derived directly from the data.
Properties of the joint likelihood for the given map and trait data can be studied by simulating this Markov chain, letting it run for many steps. In particular, the marginal distribution of the loci, averaged across all possible effects, can be estimated. The precision and efficiency of the estimate depends on how long the Markov chain is run and how it is sampled. Preliminary studies [\protect\citeauthoryearSatagopan, Yandell, Newton, and OsbornSatagopan et al.1995] indicate that substantial effects (e.g. effects of 5 standard errors or more) for samples of 100 individuals can be characterized reasonably well in 100,000 steps of a Markov chain. While this seems large, modern workstations can handle this in minutes.