


Consider an agronomic trait measured in a population of offspring in one environment. If it is controlled by a single gene at a known locus, then the trait response can be written as
trait = mean + effect of geno + error ,
in which the overall mean is the average response across the genotypes in this environment, geno signifies the genotype and effect is the genotype effect. The mean and effect are unknowns, with the effect being the main interest. In a doubled haploid (DH) or backcross (BC) population of offsprings, the genotype might be coded as -1 (A parent type) and +1 (B parent type), and the effect would only be additive,
trait = mean + add * geno + error .
In an F2 population, there is the possibility of hybrid (H) offspring (coded as 0 numerically), and hence dominance can be investigated,
trait = mean + add * geno + dom * (1-abs(geno)) + error ,
in which abs is the absolute value. For convenience below, following a SAS-type convention [\protect\citeauthoryearLittell, Freund, and SpectorLittell et al.1991], the model is written simply as
trait = mean + geno + error .
The unexplained error includes many sources of variation, such as measurement error, microclimate and microenvironment, seed-to-seed differences, and so on. It is often assumed that errors are symmetric about zero (0), with a histogram much like a ``bell-shaped,'' or normal, curve. Whenever possible, it is important to incorporate information about known sources of variation into the model. Further, one should always check assumptions. These issues are addressed in more detail toward the end of this chapter.
These linear models provide a concise way to describe key aspects of the genetic and environmental story. They translate directly into statistical packages for data analysis. [For simplicity, data analysis is illustrated with the SAS procedure glm [\protect\citeauthoryearLittell, Freund, and SpectorLittell et al.1991], although other packages and procedures would give similar results.] Let's suppose the genotypes were coded as for the two parent types (A,B) and the hybrid type (H), along with a period (.) for missing data. Suppose that the genotypes (geno) and trait values (trait) are recorded as three columns in a file called trait.dat. The first model, fitting genoyptes, looks like this:
data genes;
   infile 'trait.dat';
   input geno $ days;
   trait = log10(days);
proc glm data=genes;  /* completely randomized design (CRD) */
   class geno;
   model trait = geno;
   /* get best estimates (least squares means) of genotypes */
   lsmeans geno / stderr pdiff;
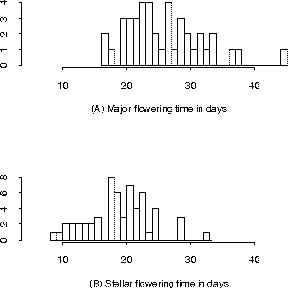
Figure 1: Histograms of Days to Flower by Genotype
Figure 1 shows histograms for days to flower in the double haploid (DH) population of Brassica napus with offspring typed by a marker (WG6B10). The population has been divided into two sets according to the genotype at a putative gene locus. Analysis of this trait reveals information as summarized in the following table, which has been edited to remove non-significant digits. The means (and standard errors) by parent type were 1.404 (.018) for Major (A) and 1.276 (.014) for Stellar (B). The overall test for significant difference had an F Value of 31.33, which has highly significant p-value (Pr > F is less than .0001). However, the R-Square, or explained variation, is only 27.1%, which makes sense given the spread in the histograms of Figure 1.
                     Sum of    Mean
Source           DF Squares  Square  F Value  Pr > F
Model             1  0.4528  0.4528    36.49  0.0001
Error            98  1.2161  0.0124
Corrected Total  99  1.6689

R-Square  C.V.  Root MSE  TRAIT Mean
0.271     8.40  0.111     1.325

Type       lsmean   stderr
A=Major    1.404    0.018
B=Stellar  1.276    0.014