|
|

|
||||||
Epistemic Data Visualization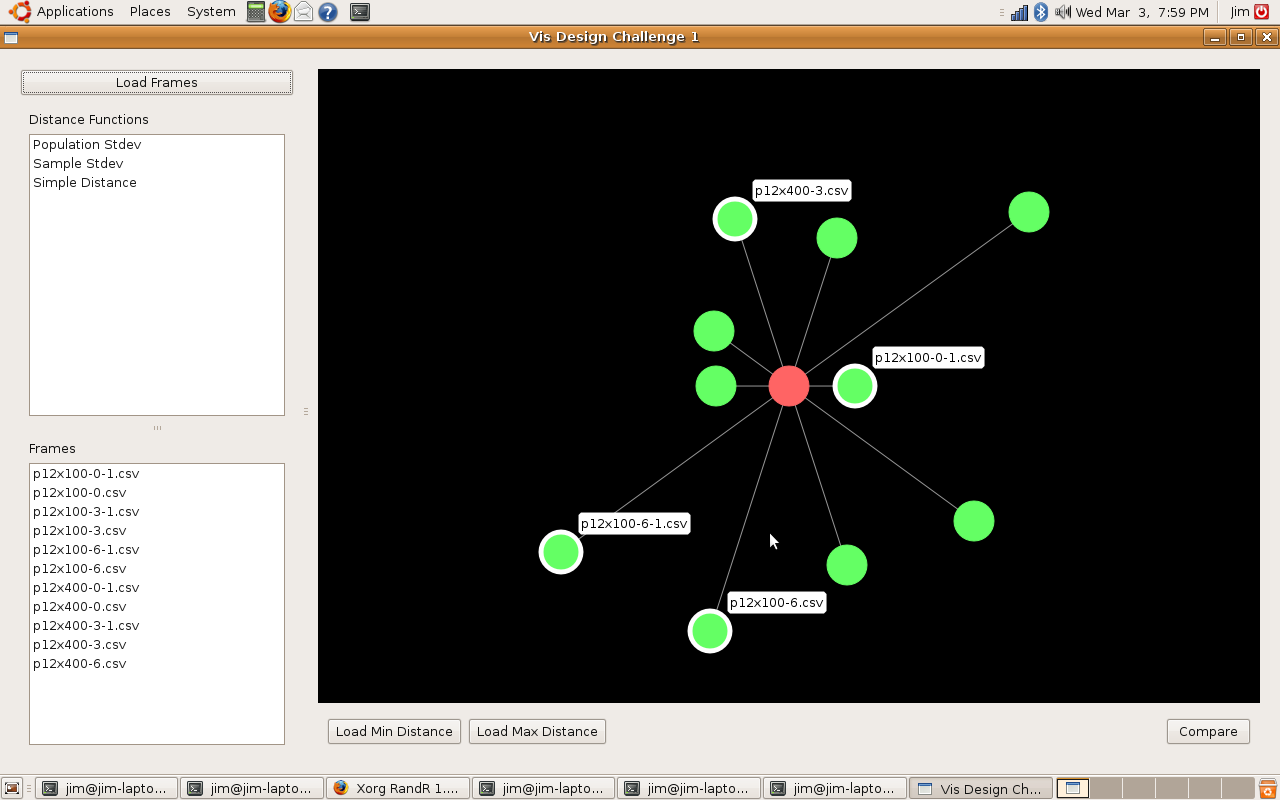
DescriptionThis is the product of a three-week design challenge in a Visualization topics course. The basic problem is to find a method of visualizising the differences in two Epistemic Frames. Epistemic Frames are basically weighted graphs where each node represents a "concept" and each connection represents how closely the concepts are weighted. The challenge in this project was to create visualizations that allow comparison between multiple frames. Three individuals contributed to this project including myself. The other members are Ye Liu and Shuang Huang. SolutionOur solution is to create a tool that allows the user to load Frame data in a specified format and view it at three levels. Level 1At the first level, the user can view clustering of frame data about a reference frame given a distance function. The distance function is written in such a way that a number is generated given two frames. This number represents the "distance" between the two frames. The view plots the reference frame at the center of the view and plots all other frames around the reference frame at distances that are proportional to the distance returned by the distance function. There is no data encoded in the position of the encircling frames; they are displayed this way to make good use of the space and to help see clustering patterns in the frame data. Two buttons "Load Min Distance" and "Load Max Distance" are provided to select the reference frame that has the smallest and largest distance to each frame. The view is interactive. By hovering the mouse over a node, the name of the frame it represents is displayed. Double-clicking a node changes that node to the reference frame and replots all other nodes accordingly. Single-clicking on a node "selects" it. Selected nodes are used when the "Compare" button is pressed. The compare button simply opens the second and third views given the selected frames. In the interests of keeping this tool extensible, every effort has been made to make adding difference functions as simple as possible. Difference functions are handled using a map of function pointers and as such, once a function with the appropriate declaration has been written, it can be added by simply inserting it into a map. This requires only modifying one file not including any code required for the distance function. Level 2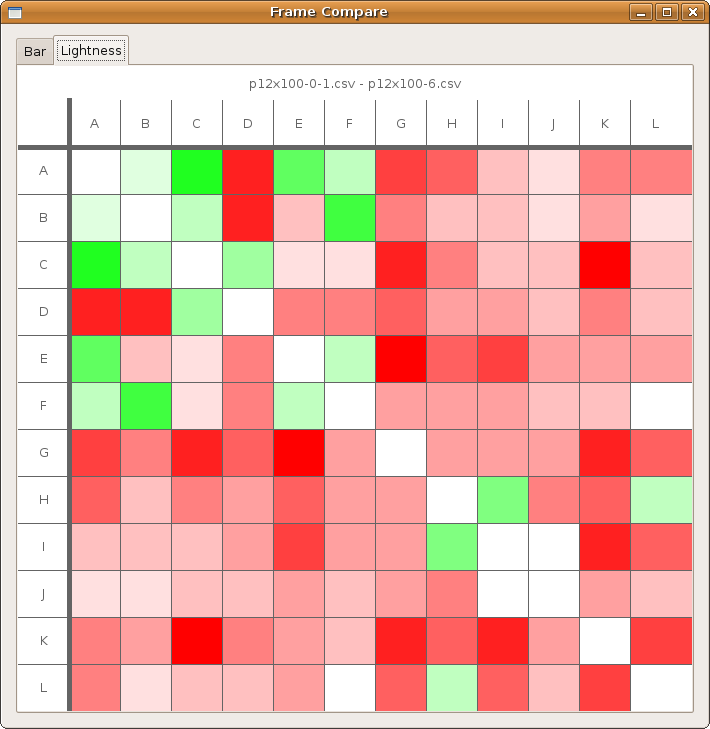
The second view can show the differences between two frames. When the "Compare" button is pressed, the first two frames found in the set of selected frames are used for the comparison. The concept of the second view is simple. The two frames are subtracted from each other. The size of the difference is encoded in the saturation of the box. If the difference is positive, a green hue is used; otherwise, a red hue is used. This view is best suited for finding a general distribution of differences in the two frames; high saturation means there is a large difference while low saturation means a small difference. Seeing a matrix with evenly distributed colors means that the two frames differ in each element by about the same amount. Seeing one or two solid colors with the rest close to white means that there are only a few differences between the elements. Level 3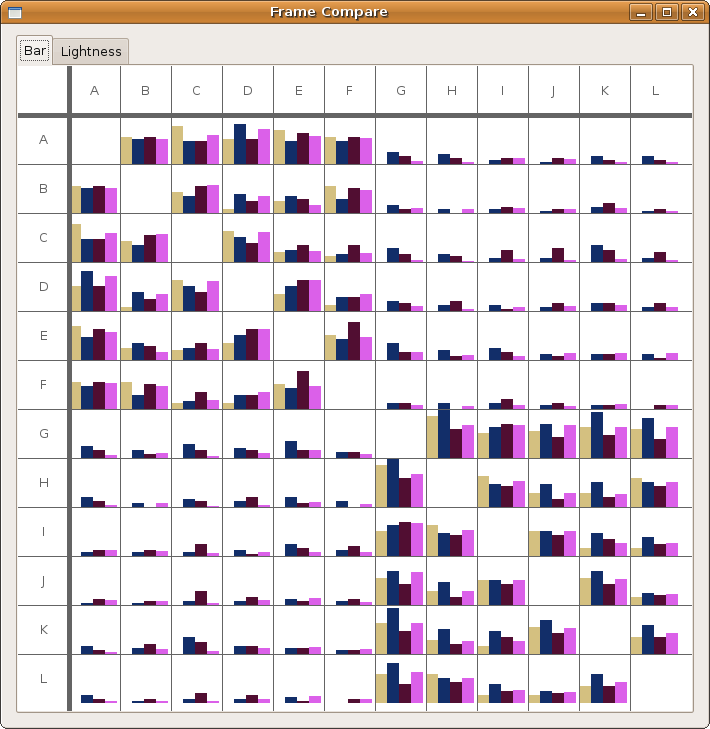
The third view is presented at the same level as the second view because it attempts to compare frame elements. In this case, the visualization attempts to show the differences between elements of more than two frames. This is accomplished by displaying a bar chart for each element. Currently colors are generated randomly and there is no key. These may be added in later versions if requested. Frame input formatFrames are loaded from .csv files which encode the data as adjacency matricies. The file must contain only lines of numbers and the number of numbers per line must equal the number of rows in the file. Minimal error checking has been implemented at this point and the program may crash if badly-formed input is used. Sample Frame Data can be found here . ExtensibilityAs mentioned before, this tool was designed to be extensible. The user has the ability add distance functions in the first view and the ability to derive from the DiffWidget class and implement the appropriate functions for displaying a new visualization. Adding new views is slightly more complicated but any competent C++ programmer should be able to do it. ImplementationThis tool was created entirely in C++ using the Qt windowing libraries for platform compatibility. Source CodeI am releasing this code under the terms of the Gnu Public License (GPL). A copy of the license in included in the zip file. I am also including a zip file of the win32 binary compiled using mingw. included with this is mingwm10.dll which is required to run the binary. This is also free to distribute and the license is included in the zip file.
|