Examples:
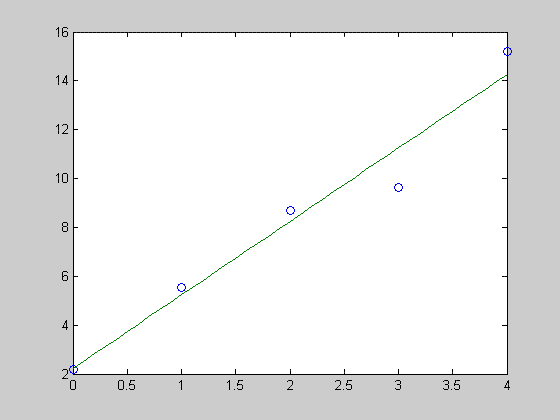
The following Matlab commands approximate the data with an exponential function.
x = 0 1 2 3 4
y = 9 250 6E3 1.5E5 4E6
x = [0 1 2 3 4];

          y = [9 250 6e3 1.5e4 4e6];

          u = log(y);

        coef = polyfit(x,u,1)  % Fit to y = c*exp(ax)

        a = coef(1)

        c = exp(coef(2))

        xx = 0:0.1:4;

        yylog = polyval(coef,xx);

        plot(x,u,'o',xx,yylog)


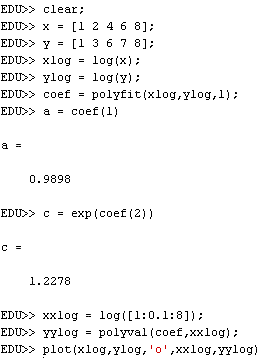
Note that the semilog plot is most convenient because the range of the linear plot would be so large that the leftmost data points would not be seen. This is usually the case when plotting exponential data fits. The closeness of the data points to the line are also an indication of how good the approximation is.The following Matlab commands approximate the data with a power law function and plot the result.
x = 1 2 4 6 8
y = 1 3 6 7 8clear; x = [1 2 4 6 8];
y = [1 3 6 7 8];
xlog = log(x);
ylog = log(y);
coef = polyfit(xlog,ylog,1);
a = coef(1)
c = exp(coef(2))
xxlog = log([1:0.1:8]);
yylog = polyval(coef,xxlog);
plot(xlog,ylog,'o',xxlog,yylog)


