

Examples
- Write a script that computes and plots the sine and cosine curves from 0 to 2*pi.
i. Open a blank document in the editor.
ii. Save the new document asplot_trig.m.
iii. Type the following in the document and save.
iv. Execute your script by clicking the Run button.xdata = [0:pi/100:2*pi] sindata = sin(xdata); cosdata = cos(xdata); plot( xdata,sindata, xdata,cosdata )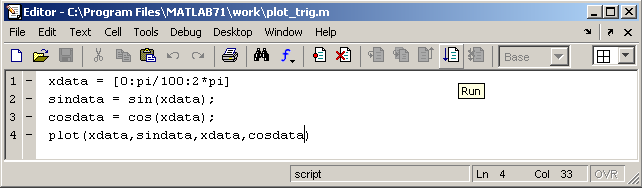
Notice, that the first line does not start with the word
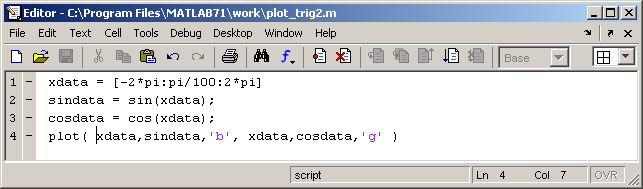
function. There are other differences between program scripts and functions in Matlab. You can execute the script by typing its name in the command window, but you can also just click the Run button in the editor's menu bar. Be sure to try execute the script both ways. - Modify your script so that computes and plots the curves from -2*pi to 2*pi, and plots the sine curve in blue and the cosine in green.
Another benefit of writing scripts for your solutions is because you can copy a program file that is similar to a new problem and then edit the new file to create the new solution. This is less error-prone than retyping lots of similar and trivial code. However, it is still critical to trace the code and be sure that you have not forgotten anything for the new program.