Exercises
-
Solve the ODE:
 with a=5 and g=0.1. However, solve the ODE with the intial condition y(0)=100 and then solve with the initial condition y(0)=10.
Then plot both solutions on an appropriate time scale(x) to see the steady state behavior of both solutions on the same plot.
with a=5 and g=0.1. However, solve the ODE with the intial condition y(0)=100 and then solve with the initial condition y(0)=10.
Then plot both solutions on an appropriate time scale(x) to see the steady state behavior of both solutions on the same plot.
The following are two possible ways to do this problem, there are MANY other ways to do this problem:
METHOD 1 (All commands)
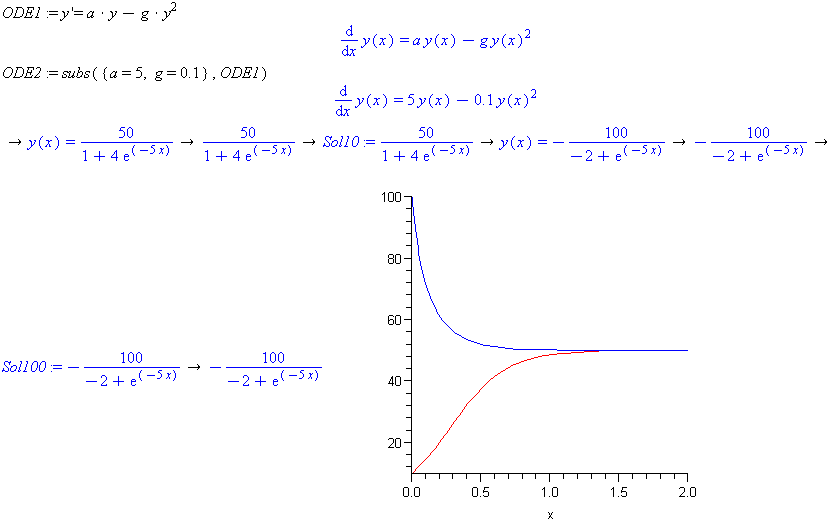
          ODE1:= y'a*y-g*y^2

          ODE2:=subs({a=5, g=0.1}, ODE1)

          sol1:=dsolve([ODE2, y(0)=100], y(x))

          sol2:=dsolve([ODE2, y(0)=10], y(x))

          plot([rhs(sol1), rhs(sol2)], x=0..2)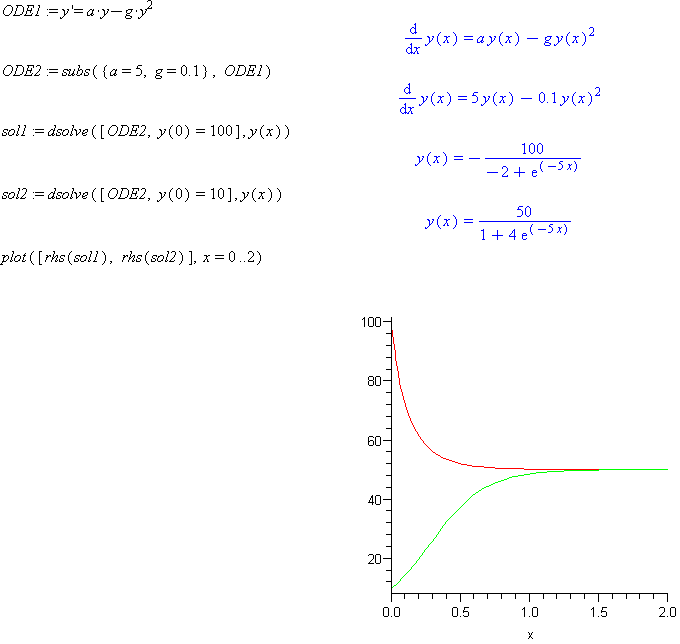
METHOD 2 (DE interactive)
ODE1:=y'=a*y-g*y^2Right click-> Solve DE interactively
ODE2:=subs({a=5, g=0.1}, ODE1)
Click->Conditions-> Edit-> y at 0 = 100 ->Add -> Done
Click-> Solve Symbolically
Click-> Solve
Change bottom left of window to read: "On Quit, Return Solution"
Click-> Quit
Right click on solution -> Right hand-side
Right click-> Assign to a Name: Sol100
Repeat the steps from Solve DE interactively down but use the condition y at 0 =10 and in the last step give the name Sol10
Open Plot Builder
Add Sol10 and Sol100
Click Done and select 2-D plot from 0 to 2