R-Tree Validation Example

Input Data
The input data:
- consists of three separate data sets, one for each level of the tree.
- was produced by dumping the R-Tree after it was bulk loaded (the data
in the tree is Tiger geographic data from Orange County, California).
- contains the attributes: page ID, level, x, y, width, height, and color.
(Color is used to make it easier to distinguish the various nodes at
levels 2 and 3.)
The level 1 input file looks like:
1234 1 484402.500000 763222.500000 968413.000000 284401.000000 35
1234 1 1671075.500000 682544.000000 789569.000000 484602.000000 35
...
Problem
We want to determine whether the R-Tree bulk loading algorithm has produced
a "good" R-Tree (not just one that is correct, but one that is
well-structured and will result in efficient searches of the data).
Visualization
Click here to see our model of creating
visualizations.
The visualization is created as follows:
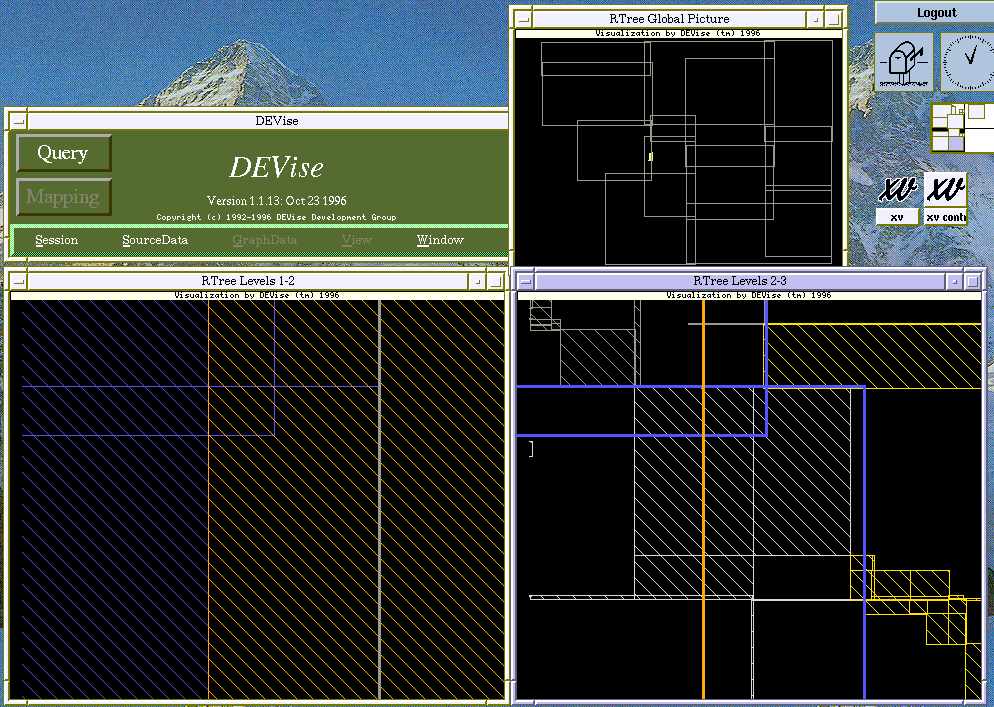
- Define the 'RTree Global Picture' window. This window simply displays
the level 1 data.
- Define the 'RTree Levels 1-2' window, consisting of two piled views,
one of the level 1 data and one of the level 2 data. One of these views
is the source for the cursor (the small yellow box) displayed in the
'RTree Global Picture' window. This means that the area displayed in
the entire 'RTree Levels 1-2' window corresponds to the area within
the cursor in the 'RTree Global Picture' window.
- Define the 'RTree Levels 2-3' window. This again consists of two
piled views, this time for levels 2 and 3 of the tree (level 3 is the
actual objects inserted into the tree). The views in this window are
linked to the 'RTree Levels 1-2' window, so that the region displayed
in the two windows is the same.
Observations
This visualization was used to find some subtle bugs in the R-Tree
bulk loading code. These bugs would have otherwise been difficult
to find, because they did not produce incorrect results; rather, they
represented a suboptimal R-Tree structure that would cause inefficient
searches of the data.
The data as it is shown represent the R-Tree after the bugs were fixed.
When the bugs still existed, it was possible to find "bad" areas of the
R-Tree by examining the visualization.
For more information on R-Trees, see the paper
Using Constraints to Query R*-Trees.
Back to DEVise home page.
