|
|
||||||||||||||||||||||||||||||||||||||||||||||||||||||||||||||||||||||||||||||||||||||||||||||||||||||||||||||||||||||||||||||||||||||||||||||||||||||||||||||||||||||||||||||||||||||||||||||||||||||||||||||||||||||||||||||||||
Updated 14 SEPTEMBER 2005: Completed event execution time profiling. Event Count ProfilingBelow is a fast-and-loose first look at the potential for parallelizing Ruby. Specifically, I have profiled the number of events happening in a given Ruby Cycle (tick), and produced a histogram the data acquired. I profiled Ruby's event queue (EventQueue.C, Research Tree) with the following workloads and configurations (the caches were warmed-up for all of the configurations): (note: all workloads are 16-processor; CMP configuration was 4-way CMP)
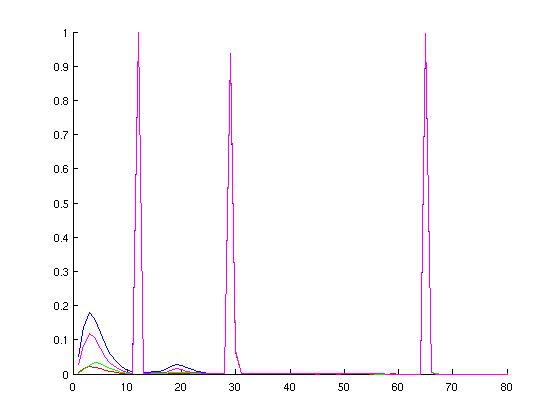
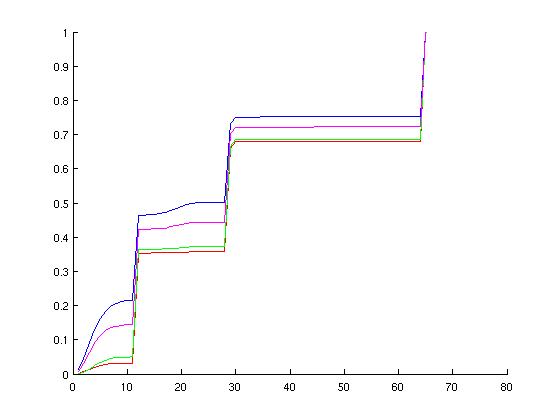
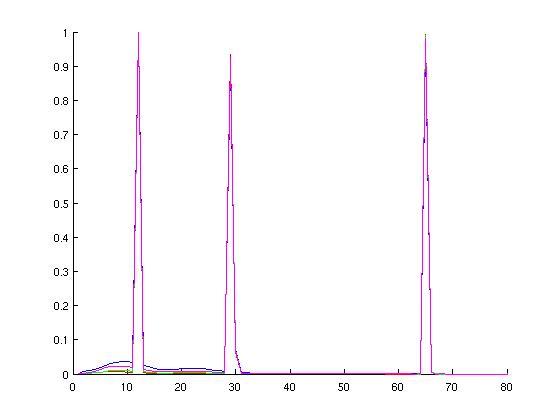
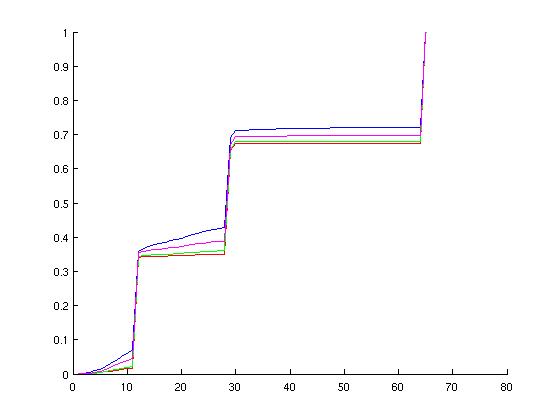
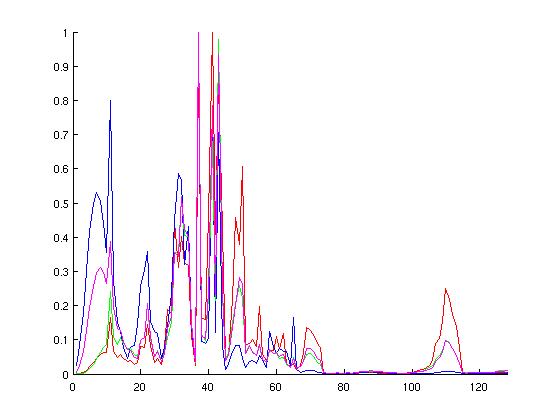
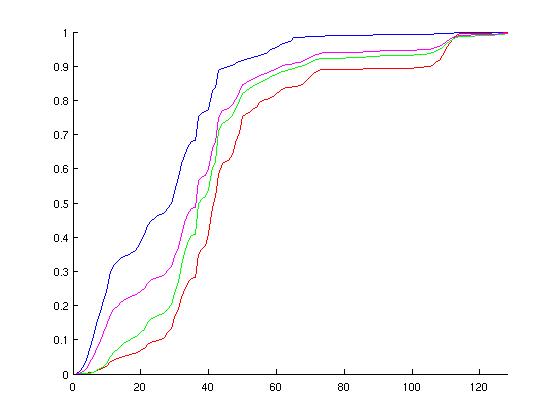
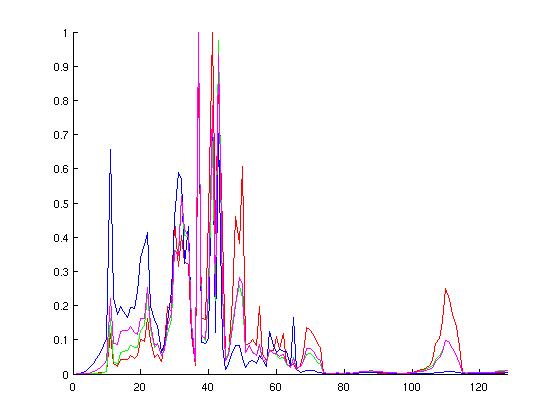
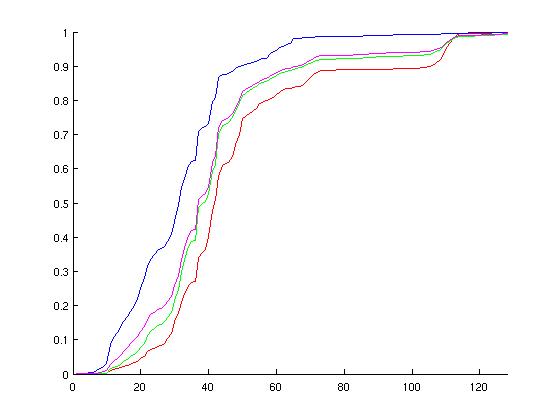
I chose these configurations hoping to cover a wide range of possible simulation environments. Below are graphs of the probablity distirbution functions of the above runs, followed by the cumulative distributions. On each of these normalized graphs, the x-axis represents "events in a ruby cycle," aka potential for parallelism. The y-axis is the normalized (observed) probablity. The left-hand graphs are histograms, somewhat analagous to the probability distribution function, whereas the right-hand graphs are cumulative distribution functions of the various configurations. When looking at the graphs, spikes in the left-hand graphs indicate a lot of ruby cycles that have that particular number of wakeup events--these spikes correspond to increases in the right-hand graphs.
|
|
|
MOSI_bcast / Opal
|
|
MOESI_CMP_directory / Simics
|
|
MOESI_CMP_directory / Opal
|
|
Raw Data ( median / mean / max )
| Simics | MOSI_bcast | MOESI_CMP_directory |
| JBB/100 | 29/23.3/125 | 42/48.0/145 |
| OLTP/5 | 23/28.0/124 | 30/27.3/140 |
| APACHE/8 | 29/33.7/125 | 38/42.3/144 |
| ZEUS/8 | 29/30.5/125 | 37/37.3/143 |
| Opal | MOSI_bcast | MOESI_CMP_directory |
| JBB/100 | 29/34.8/125 | 42/48.9/143 |
| OLTP/5 | 29/34.4/125 | 32/32.1/141 |
| APACHE/8 | 29/34.4/124 | 39/43.5/145 |
| ZEUS/8 | 29/33.4/125 | 37/41.7/143 |
Discussion
Discounting possible dependencies and load-balancing issues, I think there is potential in parallelizing Ruby's event queue on a per-wakeup-event basis. Specifically, note from the CDF graphs that more than half of the used ticks are handling twenty or more events for each configuration examined. Additionally, note the peaks in the MOSI_bcast histograms. These peaks correspond to broadcast events to successively larger groups of consumers. The first of these peaks is around 11-12 events.
Caveats:
This data shows the number of events processed per cycle, but the question of dependency among events is unaddressed. Theoretically, all wakeup events should be independent, but I have not explored the truth of the implementation. That is, dependency between events will be a major obstacle to parallelizing Ruby in this fashion.
The issue of non-determinancy still exists with the parallelization. Since Ruby's event queue is unordered for a single-cycle, and there are no zero-cycle delays, simulation results should be deterministic under this parallelization scheme. However, races among threads will still cause events to be handled in different orders in different executions. For working code, this is not an issue, but complex interactions between threads will greatly complicate the debugging process of Ruby.
To some extent, determinancy can be bought back if we pay a small amount in performance. Specifically, enforcing threads to handle wakeups in thread order will make simulation more deterministic, if not completely deterministic (again, due to unknown dependencies between wakeup events). If thread N may only take a wakeup event from the queue immediately after thread N-1, then each thread will always handle the same set of events in an execution, but if N-1's event is short and N's is long, then N-1 and subsequent threads may wait a long time before N's task completes.
Event Duration Profiling
The above profiles the number of events in a given Ruby cycle, but says nothing about the duration of the events. Below, I present statistics regarding duration of tasks in Ruby, corresponding to "wakeup" events. Opal was not loaded for any configurations in this profiling run. Additionally, the number of transactions was further reduced, to keep trace size manageable.
These experiments were performed on an otherwise unloaded s0 machine, using x86 cycle counters to measure elapsed time. All times are presetned below in microseconds. For reference, this particular s0 machine is clocked at approximately 2.190 GHz, implying 2190 cycles per microsecond.
| Protocol | Network | Workload | Transactions |
| MOSI_bcast | Hierarchical Switch | JBB_Warm | 10 |
| MOSI_bcast | Hierarchical Switch | OLTP_Warm | 2 |
| MOSI_bcast | Hierarchical Switch | Apache | 2 |
| MOSI_bcast | Hierarchical Switch | Zeus | 2 |
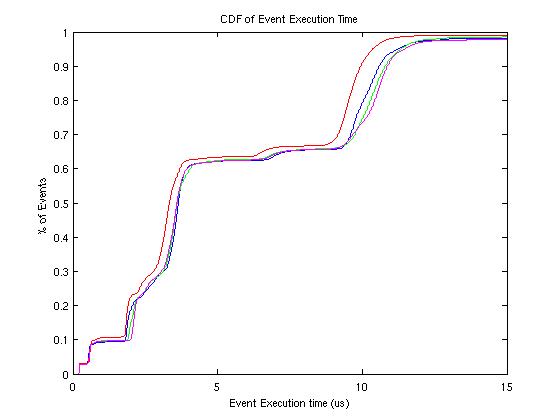
The graph below shows the cumulative distribution functions for the various configurations. The x-axis variable is execution time for a given event; the y-axis represents the percentage of all events that execute in less time than the value of x.
Raw Data
| Workload | Median Exec. Time (us) | Mean | Min | Max | STDDEV |
| JBB/10 | 1538 | 4453 | 433 | 1175223 | 6687 |
| OLTP/2 | 1420 | 4704 | 389 | 1066426 | 7101 |
| APACHE/2 | 1598 | 4785 | 387 | 1054861 | 6888 |
| ZEUS/2 | 1490 | 4824 | 386 | 1792324 | 9876 |
Discussion
For the examined protocol, observe the plateau behavior of the CDF at 1us/10%, 4us/60%, and 12us/100%. One can infer that approximately half of the events profiled have execution times in excess of 4us, but the inner 90% of the distribution is very large (approximately 0.5us - 10us). Also note the correlation between the execution-time CDFs and the event count CDFs for the MOSI_bcast protocol. This close correlation may imply a strong relationship between the number of events and the execution time for single events.
Potential for Speedup
To evaluate the potential speedup the can be attained by parallelizing Ruby's Event Queue, I measured the total time spent handling events. The total execution time is already available in Profiler.C's statistics. I also evaluate the speedup for a perfect 8-way parellelization of events in Ruby, as well as infinite speedup for events in Ruby.
I did not include Opal in the following executions. The potential for (Ruby's) speedup with Opal enabled would undoubtedly be significantly smaller than presented below if Opal was included. All runs were conducted with the MOSI_bcast protocol, using the hierarchical switch network.
| Workload | Transactions | Processors | Simulation Time | Time Processing Events | Speedup w/ 8x Improvement | Speedup w/ Inf. Improvement |
| JBB | 1000 | 8 | 506 | 44.65 | 1.08 | 1.10 |
| JBB | 1000 | 16 | 707 | 113.05 | 1.16 | 1.19 |
| OLTP | 5 | 8 | 74 | 15.42 | 1.22 | 1.26 |
| OLTP | 5 | 16 | 190 | 55.67 | 1.34 | 1.42 |
| Ocean | (66x66) | 16 | 1623 | 291.92 | 1.19 | 1.22 |
Discussion
While there seem to be an abundance of events that are many microseconds in duration, the total amount of work under consideration for parallelization pales in comparison to that of Simics and other parts of Ruby. The best-case effect of parallelizing Ruby at its event queue would be at best a 50% performance improvement, assuming Opal is not loaded.
The potential for speedup using the random tester is more promising (Ruby's events account for around 75% of execution time), but best-case speedup for the tester is still upper-bounded by four. However, runtimes for the tester are already manageable, if not realtime.
Considering there is very little opportunity to improve Ruby's runtime with this parallelization scheme, I am not planning any further exploration of parallelizing Ruby's event queue.
As always, I welcome feedback on this topic from anyone.
Best viewed on Google Chrome. Get it here.
![gibson[at]cs.wisc.edu](Images/email.jpg)
![[Image]](Images/dan.jpg)
