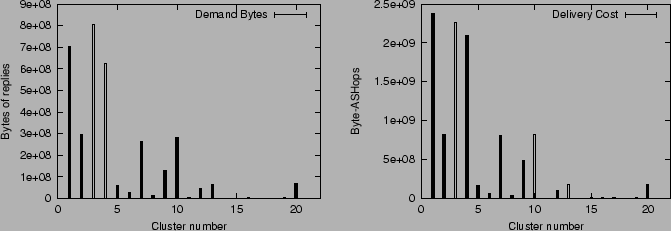
Figure 3 shows the aggregate demand from each of the 21 major clusters in both bytes and byte-ASHops. The graphs show that the commercial web server had clients that were concentrated in certain areas of the Internet. The 3 busiest were the clusters whose exemplars were Verio, Alternet, and AT&T with 64 percent of the bytes and 63 percent of the byte-ASHops in replies. The BBNPlanet cluster was particularly interesting because it was also one of the best trees for delivering the test data in the fewest ASHops (2.752 ASHops including 1 for BBNPlanet and 1 for the root). The clusters with averages above 3.5 ASHops were those represented by ESNET, UUNET-Europe, LINX and EBONE.