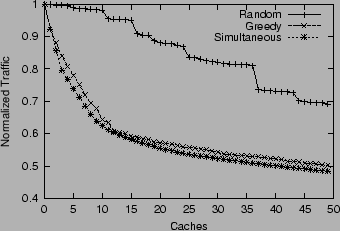
To measure the benefit of each new cache added to the tree, we compute the total traffic seen by the sample web server log. Figure 5 shows the total traffic normalized to the traffic that would result if 0 caches are used. In our test data, 3.41 Gigabytes of replies came from 790 of the 6395 clusters. Using the tree produced by the clustering algorithm, on average traffic touched 3.07 AS's including the AS at the backbone and the originating AS. Throughout the rest of this paper, we will use the term ASHop to avoid confusion with router hops. The total cost of traffic in this test data was 10.46 Gigabyte-ASHops.