 |
For this study a ![]() tolerance growth of 0.25 per pass was chosen.
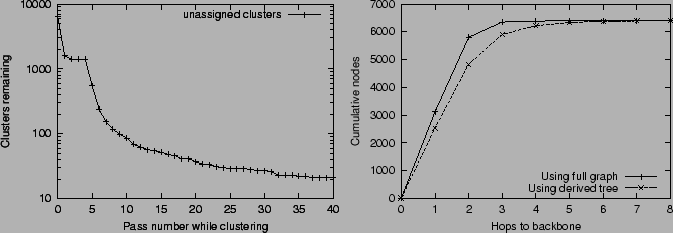
Figure 2 shows the number of clusters at the end of each pass through
the list of AS's. The first
four passes cluster all of the easily-classified AS's with small out-degree. Passes five through ten found
a large number of national, government, and educational transit AS's. After the pass 37, further
reduction in the number of clusters takes much longer.
To avoid excess layers at the top of the tree, we stopped the algorithm at pass 40 and declared the
21 remaining exemplars to be the first layer of the tree.
tolerance growth of 0.25 per pass was chosen.
Figure 2 shows the number of clusters at the end of each pass through
the list of AS's. The first
four passes cluster all of the easily-classified AS's with small out-degree. Passes five through ten found
a large number of national, government, and educational transit AS's. After the pass 37, further
reduction in the number of clusters takes much longer.
To avoid excess layers at the top of the tree, we stopped the algorithm at pass 40 and declared the
21 remaining exemplars to be the first layer of the tree.
Figure 2 also compares the cumulative distribution of distances to the backbone in both the original full graph and the tree left at the end of clustering. The maximum distance from the backbone was 5 in the full graph but rose to 8 in the tree. There were only 56 nodes in the tree farther than 5 hops from the backbone. This matched our goal for the backbone since over 90 percent of the 6395 nodes are within 2 hops of a backbone node in the graph and within 3 hops of a backbone node in the tree. The average node is 1.61 hops away from the 21 ``backbone'' nodes in the full graph, and 1.96 hops away from those same 21 nodes in the computed tree.
The resulting clustering contains 21 large subtrees, each headed by a particular AS. Table 1 shows the names of those Autonomous Systems. The list does not contain some of the AS's with high out-degree. Presumably, this is because they were dominated (at some small tolerance) by an AS that is on the list. Alternet had the largest number of immediate children at 492, a little over half of its out-degree (878) in the full graph.
The tree looks more like a long row of short bushes than a tall tree. There were 2515 AS's at the second level of the tree, making the average number of children per backbone node 120. The top three levels include a total of 4833 AS's that are within 2 hops of the backbone.