Prev: Q10 Next: Q12
Back to week 13 page: Link
If your post satisfies the requirements (1), (2), (3), one of the course staff will "like" your post and you will receive 0.5 points for the post.
The past exams can be found on pages X1, X2, X3, X4, X5,
If your post satsifies the requirements (1), (2), you will receive 0.5 points for the post.
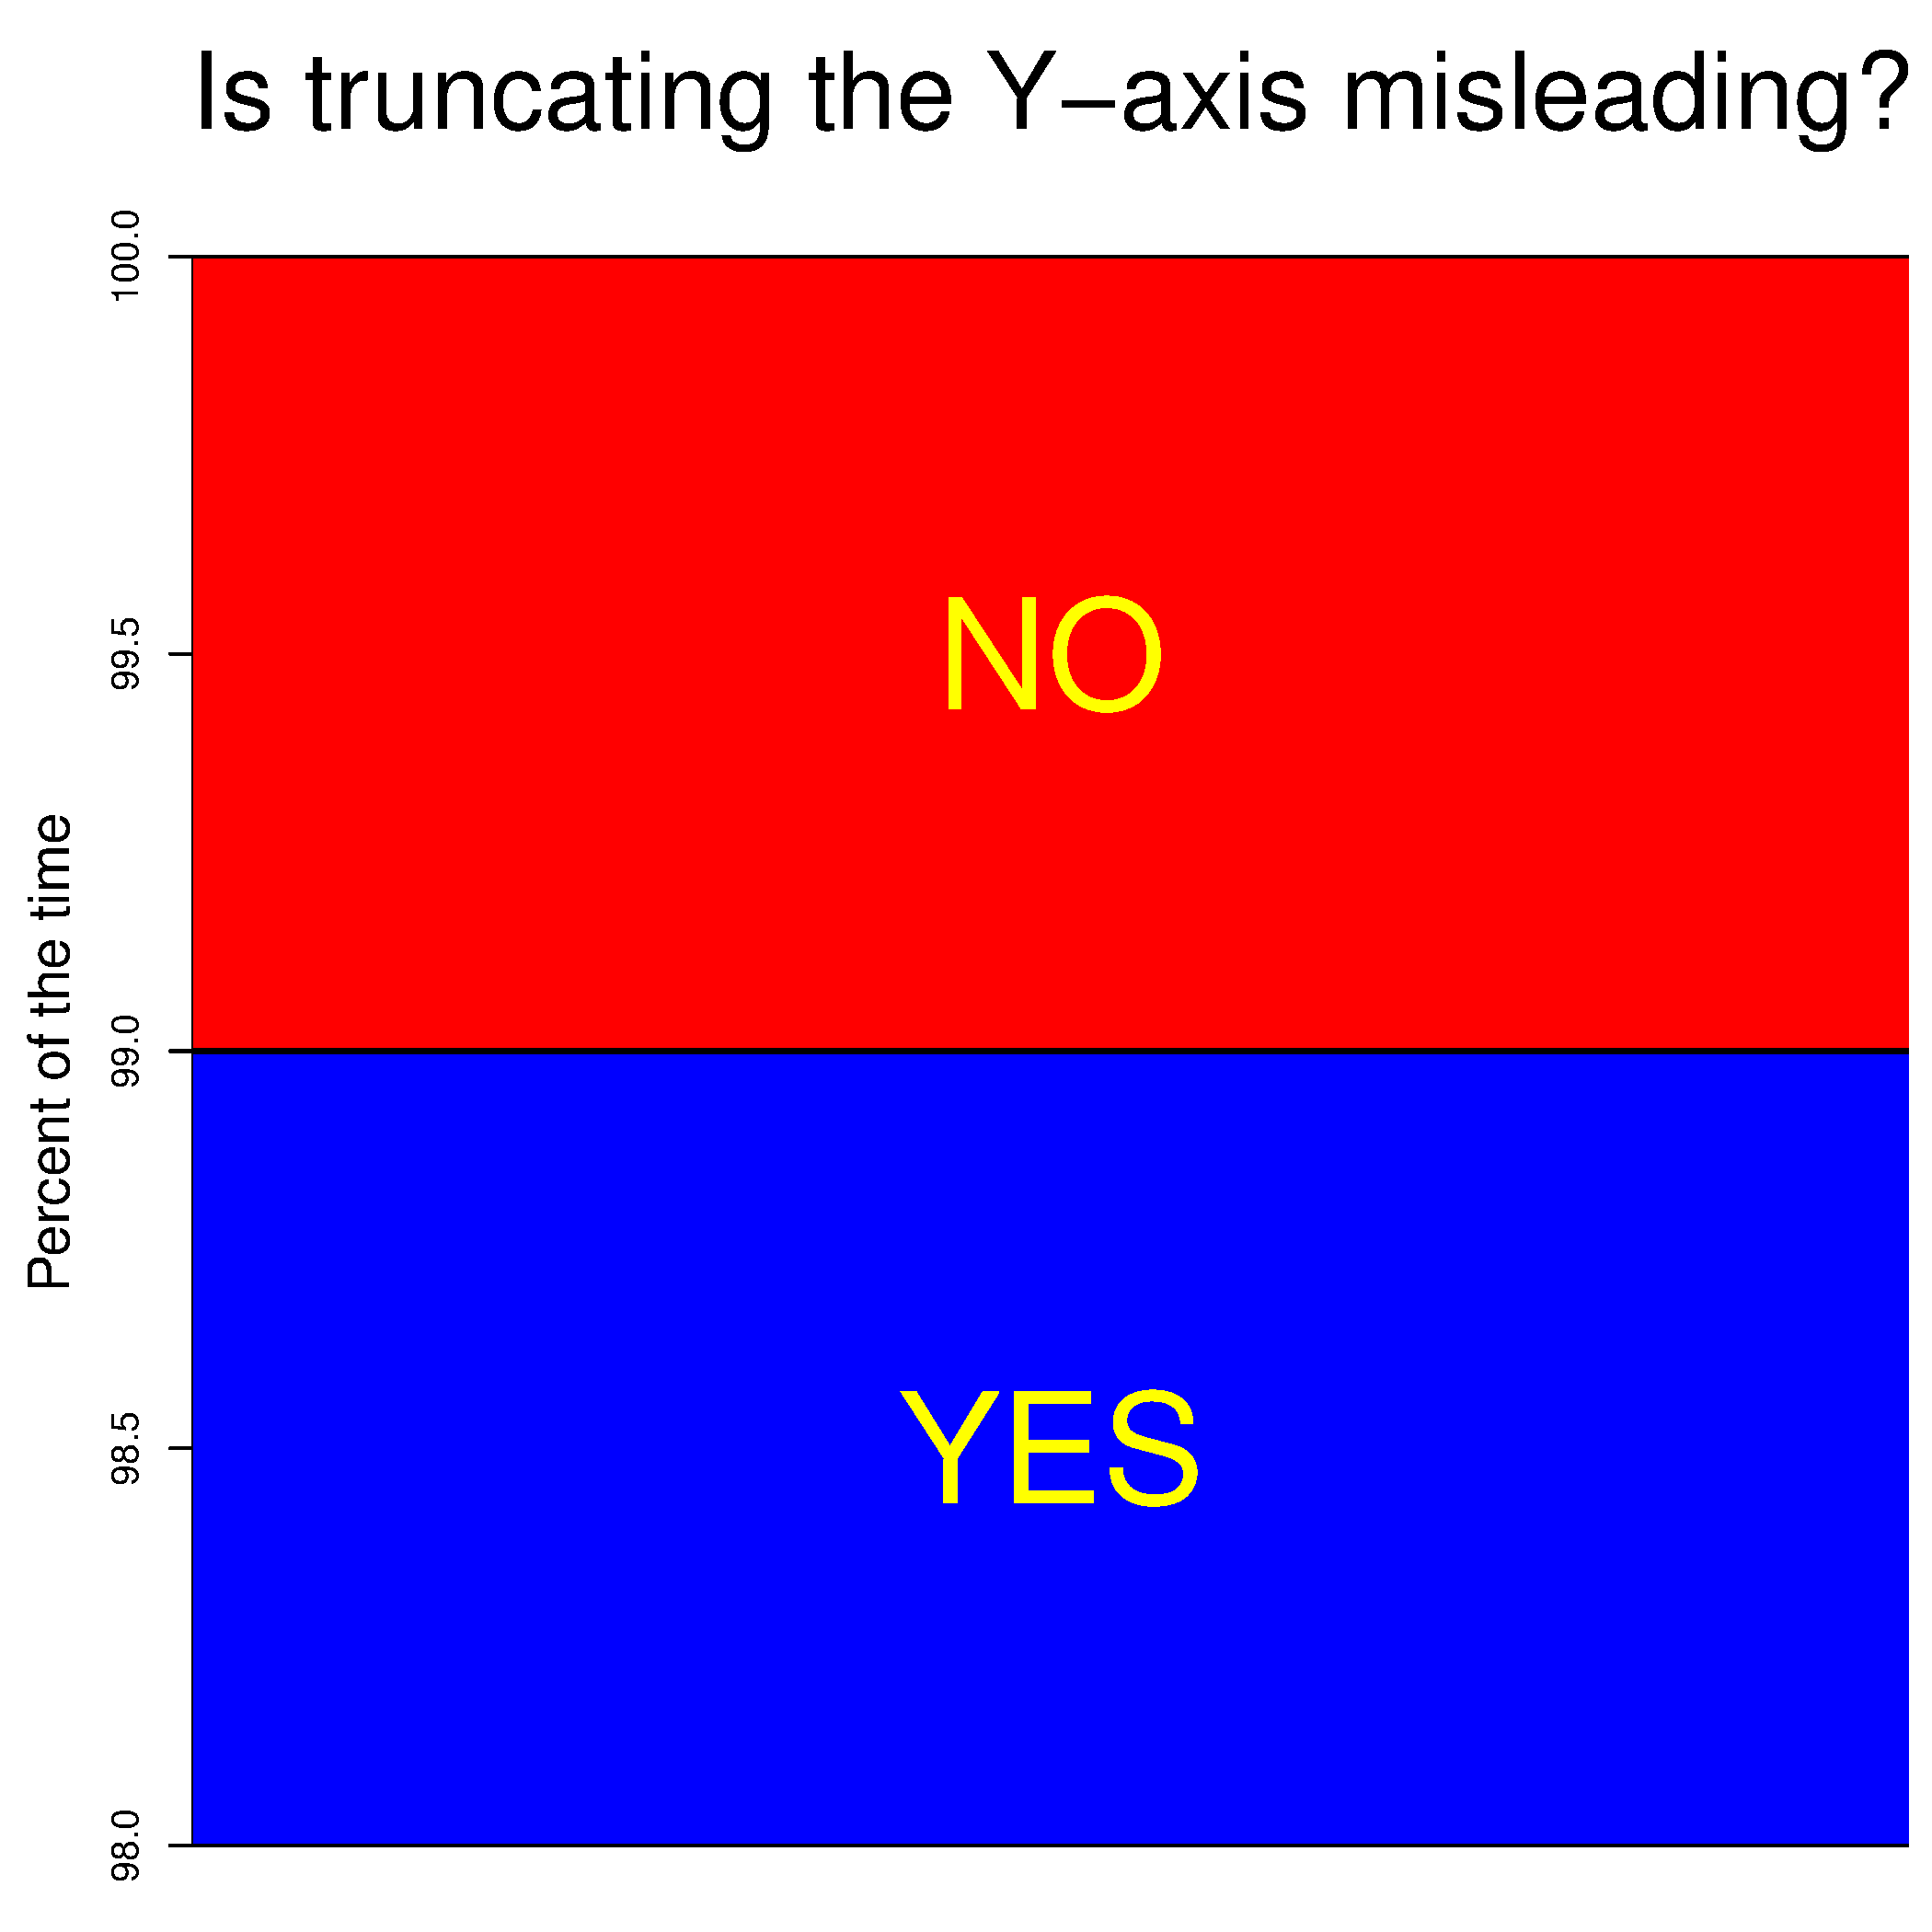
Image via imgur
Back to week 13 page: Link
# Q11 Quiz Instruction
📗 The quizzes must be completed during the lectures. No Canvas submissions are required. The grades will be updated by the end of the week on Canvas. Alternative ways to get the points are listed below in the D11 sections.
📗 Please submit a regrade request if (i) you missed a few questions because you are late or have to leave during the lecture; (ii) you selected obviously incorrect answers by mistake (one or two of these shouldn't affect your grade): Link
| Answer | Points | Out of |
| Correct | 1 | Number of Questions |
| Plausible but Incorrect | 1 | - |
| Obviously Incorrect | 0 | - |
# D11 Sharing Solutions on Piazza
📗 Use the sign-up sheet: Google Sheet. You can sign up and post anonymously (anonymous Piazza posts are not anonymous to instructors).
| Requirement | M Questions | Past Exam Questions |
| List of Questions | M12Q1-10 | X4Q10-15, X5Q1-4 |
| Due Date | August 15 | August 15 |
| Name of Post | M?Q? | X?Q? |
| Piazza Tag | m12 or d11 | m12 or d11 |
| Type of Post | public Piazza note | same |
| Include | (1) Screenshot of the question | same |
| - | (2) Detailed step-by-step solution | same |
| - | (3) Brief explanation of each step | same |
If your post satisfies the requirements (1), (2), (3), one of the course staff will "like" your post and you will receive 0.5 points for the post.
The past exams can be found on pages X1, X2, X3, X4, X5,
# D11 Discussion Topic
📗 Please create a follow-up discussion post on the Piazza (it is okay to post anonymously). No Canvas submissions are required. The grades will be updated at the end of the week on Canvas.
| Requirement | Discussion | - |
| Topic | see below | - |
| Due Date | August 15 | - |
| Type of Post | Piazza follow-up | - |
| Include | (1) Image or screenshot | - |
| - | (2) Brief discussion or explanation | (one or two sentences) |
If your post satsifies the requirements (1), (2), you will receive 0.5 points for the post.
📗 Find two visualizations of the same dataset that tell different stories (or lead to different conclusions) about the dataset. The images should be visualizations of datasets, not diagrams or photos. Share the images on Piazza and briefly explain the stories told by each visualization.
📗 One or both of the images can be visualizations you made (by hand or using a statistical software) or found on the Internet, you should explain in the post where you got the images from.
📗 You can read about misleading data visualizations (i.e. visualizations that lead people to a story that you may or may not agree with), for example: Link, Link, Link, or Link.
Image via imgur
Last Updated: June 27, 2026 at 9:06 PM