

Exercises
Please complete each exercise or answer the question before reviewing the posted solution comments.
Use the clear command before starting your work on a new problem
to ensure that any existing variable name assignments don't interfere with your work on
the new problem.
-
Plot the function
 over the domain -2 to 4.
     x = -2 : 0.2 : 4 ;
     y = 3.5 .^(-0.5.*x) .* cos(6*x) ;
     plot( x, y )
Notice that element-wise operators must be used for the power and multiplication operations. But, why didn't we have to use the element-wise multiplication operator for the
6*xoperation? Review the notes on Operators if you don't know.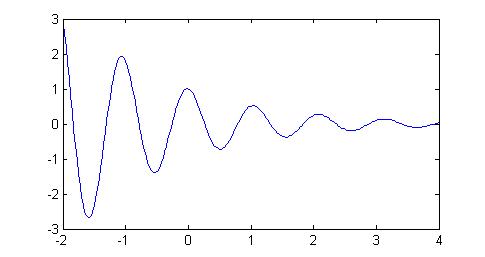
-
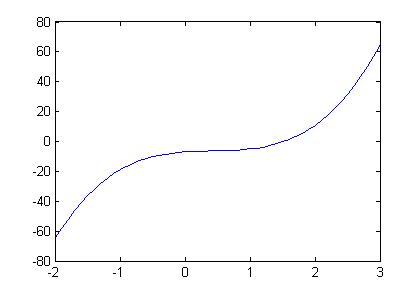
Plot the polynomial
f(x) = 4x3 + -5x2 + 3x - 7over the domainx=-2..3.x = -2 : 0.1 : 3 plot ( x, 4.*x.^3-5.*x.^2+3.*x-7 )Notice that you can enter the function inside the plot command. Though, we recommend that you define a function for a complex polynomials like this. The next lesson shows you how.
-
Plot the finite Fourier series given by the sum:
 on the interval
 x=(0,8π). The plot you should see is called the 'sawtooth function'.Here's an algorithm (set of steps) for solving this problem without iteration (loops):
1. Create a vector for all
nvalues in the sum.
2. Create a different vector for a bunch ofxvalues in the range.
3. Use thesumcommand.
4. Create theyvector
5. Plot the results.
Note: There will be other ways to solve this problem when you learn about iteration in programming.
     clear;
     figure;
     n = 1:1000 ;
     x = (0:0.1:8)*pi;

     SinNX = sin(n'*x);
     SinNXOverN = diag(1./n) * SinNX;

     SawTooth = sum( SinNXOverN );

     plot( x, SawTooth );
     axis([x(1) x(length(x)) -pi/2 pi/2])
     title('Saw Tooth')