Exercises
-
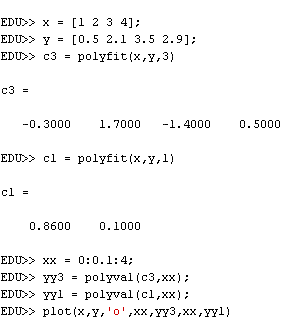
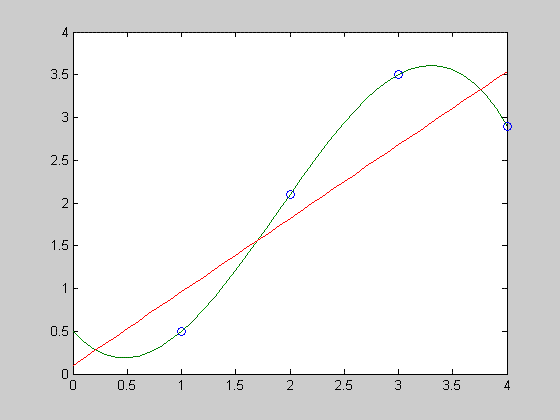
Enter the following data set into Matlab. Interpolate the data with the appropriate degree polynomial and approximate the data with a 1st degree polynomial and plot the results.
x = 1 2 3 4
y = 0.5 2.1 3.5 2.9

-
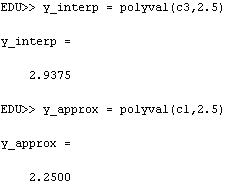
Using the data in exercise 1, compute the value of the interpolating function and the approximating function at x=2.5.


