CS 202 Fall 2011: Assignment 7
Homework Assignment #7 : Due Friday 11/4 before 5pm
Part A: How does Web Searching reveal Information?
The purpose of this assignment is to learn more how the terms that people search for using web search engines reflects (and even predicts!) what is happening in our world.For this assignment, you should explore either Google Trends or Google Insights for Search to see what terms people have been searching for. You should compare the search activity for some set of related words across some period of time and write a short (approximately one-page) essay about your findings.
We recommend that you start by going to the Trends and Insights web pages. Both of them give a good number of suggested search terms to compare.
For example, the Trends page might recommend you compare the terms "equinox, full moon, solstice". When you type in those terms, you will see a graph showing the relative popularity of those search terms over time. You might find these search terms interesting because their popularity has a strong correlation with what is happening in the real world: people tend to search for "full moon" when we are near a full moon, and "solstice" when we are near the solstice. Thus, you will see there is a periodic nature to the popularity of each search term that matches the real world.
The Trends web page will let you focus in on different time ranges and different parts of the world and shows which terms are most popular in different states and cities in the U.S.
Likewise, the Insights web page gives an overview of why you might want to use it as well as some example queries. You can compare search volume patterns across specific regions, categories, time frames and properties. For example, you can compare how the term "ski" is searched for in two different Locations: Australia and Switzerland. You will see that each has a seasonal behavior where skiing is popular in each of their winters. You can also compare the relative popularity of the two: more people ski in Switzerland than Australia.
You should pick some subject than you are interested in and see how searches for related terms have varied over time. For example, you could compare the popularity of searching for different sports teams, music groups, products, companies, political concerns, or world events. You can pick anything you like.
If you pick a subject that you have some additional knowledge of, you will likely find it easier to interpret the resulting data (e.g., if you are investigating the popularity of the New England Patriots, you will be able to connect the many searches for that term in 2003 with winning the SuperBowl). You will notice that Google Trends is sometimes able to automatically identify events in the News that occurred at the same time; these events will be explicitly marked on the graphs.
You should compare between three and five search terms that are related to your topic (e.g., comparing searches for the words Obama, Biden, McCain, Palin would give you four search terms all related to the 2008 Presidential Election). You should write a short essay describing what you found. Your essay must include the following points:
- Whether you are using Google Trends or Google Insights for Search. You should specify the exact query you gave to retrieve your results (e.g., the search terms, the locations, and the time frame). You should describe how your search terms are related (i.e., the overall subject you are investigating).
- The graph that was produced. You can include the image in your document or as a separate file, whicheve is most convenient for you.
- An objective description of the relative popularity of the search terms. For example, what is the relative ordering of popularity of the search terms? How much more popular is one term than another?
- An objective description of the popularity of the search terms over time. Is there any seasonal or regular, periodic nature to the popularity of the search times? Is the popularity of these search terms increasing or decreasing over time? Has the relative popularity of the terms changed at all over time? Are there distinct moments in time when the popularity of the search term has abruptly increased or decreased?
- A subjective discussion about the relative popularity of the search terms and their popularity over time. Why do you think some of the terms are more popular than others? How does searching for each term correlate with what is going on in the real world? What information from the other sources do you have to back up your speculations? What world events correspond to any observed peaks in search popularity?
Part B: Sorting
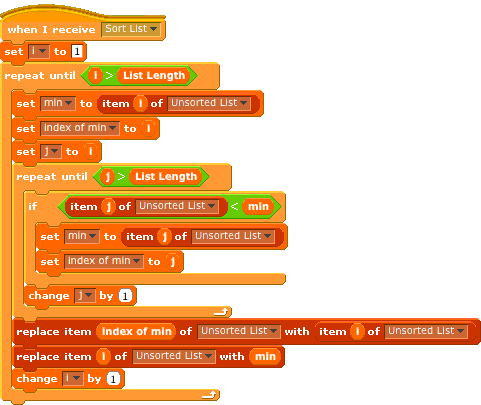
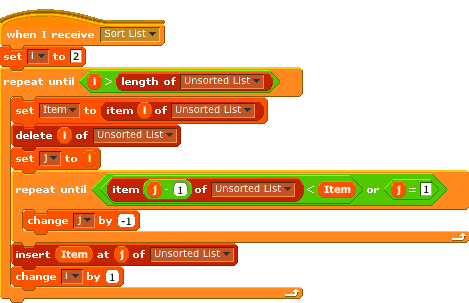
Sorting is an important algorithm in Computer Science. Selection sort and insertion sort are two intuitive, but slow, sorting algorithms. They are fine algorithms for small data sets (that is, when the value of N is small). These algorithms were covered in detail in Lecture. These two algorithms are straight-forward enough that you should be able to step through their operations by hand.

A) Imagine that you are to use a selection sort (like the one shown above). For each of the following three inputs sets, show the contents of Unsorted List at the end of each iteration of the outermost loop (where the variable i is increased). Note that each input set is a list of 10 elements.
i) 783, 928, 263, 91, 54, 234, 66, 21, 558, 782
ii) 28, 44, 99, 1001, 55, 80, 1, 9222, 56, 63
iii) 5, 20, 38, 42, 56, 68, 73, 88, 91, 106

B) Now imagine that you are to use an insertion sort (such as the one shown above) on the following lists. For each of the following three inputs sets, show the contents of Unsorted List at the end of each iteration of the outermost loop (where the variable i is increased). Note that each input set is a list of 10 elements.
i) 783, 928, 263, 91, 54, 234, 66, 21, 558, 782
ii) 28, 44, 99, 1001, 55, 80, 1, 9222, 56, 63
iii) 5, 20, 38, 42, 56, 68, 73, 88, 91, 106
C) Imagine that the numbers in the lists above are high scores; associated with each high score list is another list called "Names". The contents of the Names list is initially Alice, Bob, Charles, Doug, Ethan, Frank, George, Harriot, Ian, Janice. When this Names list is associated with the high score list from part i), then Alice has the score 783, Bob has the score 928, and so forth.
Imagine that each of the sorting algorithms (whether selection or insertion) is modified to shuffle the elements of the Names list at the same time as the elements of the High Scores list; that is, when a score that was initially at position i of the High Scores list is moved to position k, then the Name that was previoiusly at position i of the Names list should be moved to position k in the Names list as well.
What will be the final order of the Names list when the sorting algorithm runs over the List in example i)?
Part C: Technology and Education
Technology has a huge potential for impacting education. At this point, there are a wide range of opinions about whether computers and technology are beneficial in an academic setting or not.To see how technology is being used in settings very different from our CS 202 classroom, watch this video on "Digital StudyHall: Experience of Technology Development for Improving Rural Education in India". A lot of the talks on that page are very similar; make sure you select the 48 minute talk from Harvey Mudd College. Ontario, California. December 4, 2009. This video is a substitute for lecture on Friday Oct 28.
After watching the video, write a short response answering the following questions. We expect your response will be in about 3-5 paragraphs.
- How is technology being used in India by the speaker of this talk and his colleagues?
- Do you think there are opportunities for this same approach to be used in the US? If so, where? If not, why not?
- How do you think technology should be used in the US? To see different viewpoints, we suggest you read these short articles: Waldorf and Scores. It is fine that your treatment of this issue is going to be rather superficial; you can keep this very short.
Turning in your Homework
You should turn in both parts of this assignment through your Learn@UW account. To do this, we think you can follow these steps:- Login into LearnUW : "learnuw.wisc.edu" using UW NetID and password.
- Click on the link "compsci202:Introduction to Computation" under student tab.
- Click the Dropbox option which is on Top-Left of your web page.
- Click the link to the corresponding HomeWork you need to upload. It directs you to a page where you can upload files.
- Upload the desired files and submit them. Your write-up should be in a file with an extension of .doc, .docx, or .pdf.
Menu
Fall 2010Time: MWF 9:55-10:45
Room: 1221 CS
Lab: 1370 CS (1st floor)
Instructor:
Prof Andrea Arpaci-Dusseau
Office Hours
Mon 11-12, Wed 11-12
Office:
7375 Computer Sciences
Email: dusseau "at" cs.wisc.edu
