Examples:
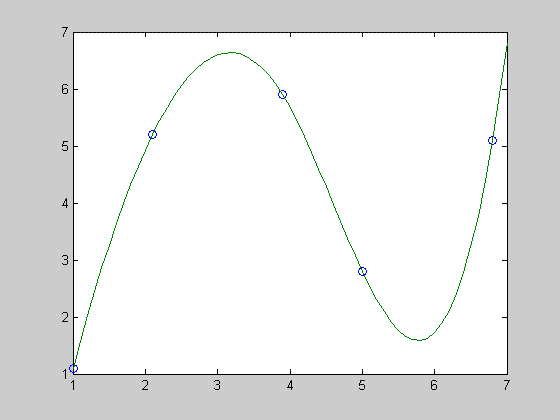
The following commands will interpolate the data using a spline function and plot the results.
          clear;
          x = [1 2.1 3.9 5.0 6.8];   %Create data

        y = [1.1 5.2 5.9 2.8 5.1];

          xx = 1:0.1:7;

        yy = spline(x,y,xx);

        plot(x,y,'o',xx,yy)

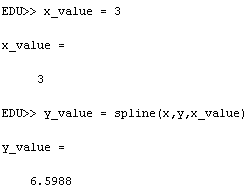
The following commands will compute the interpolated value at x=3.


