Exercises
-
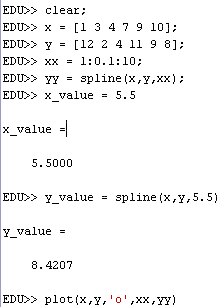
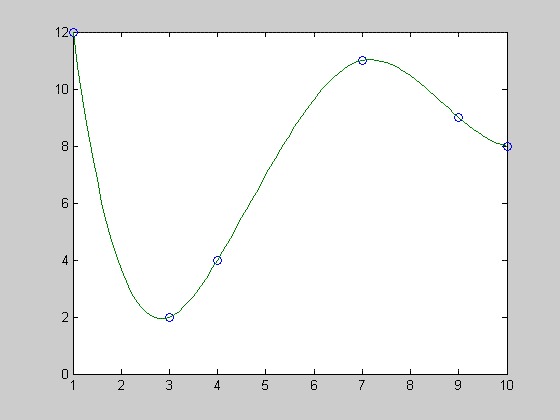
Use the spline command to interpolate and plot the data and compute the interpolated value at x=5.5.
x = 1 3 4 7 9 10
y = 12 2 4 11 9 8


Use the spline command to interpolate and plot the data and compute the interpolated value at x=5.5.
x = 1 3 4 7 9 10
y = 12 2 4 11 9 8

